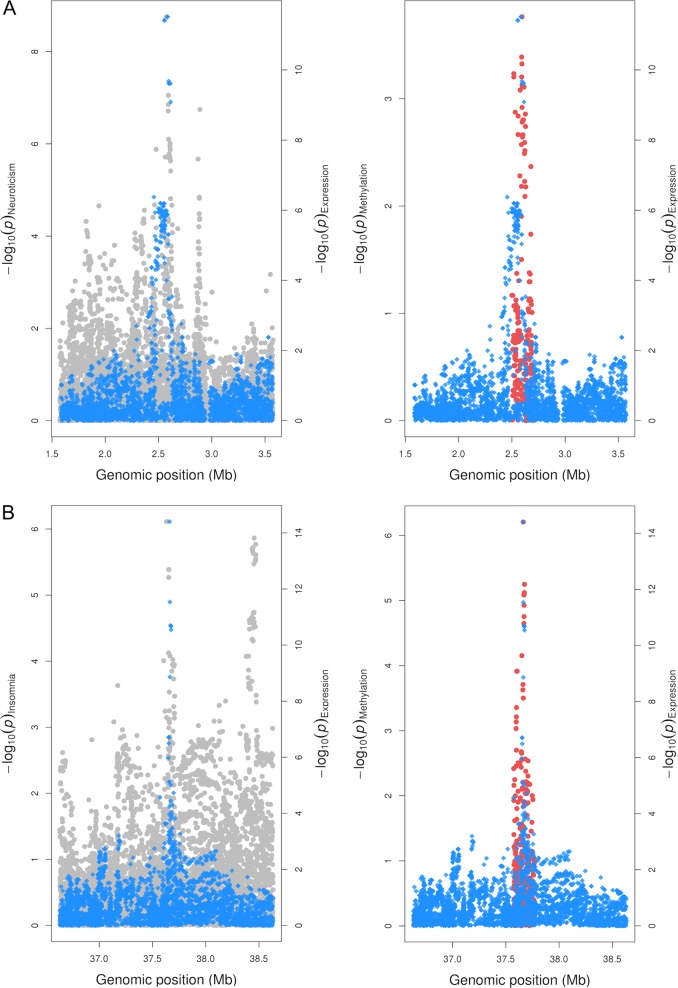
Fig. 2. Regional association plots illustrating genetic colocalization at PAFAH1B1 and MDGA1.
Regional association plots illustrating colocalizations for the PAFAH1B1 gene (a) and MDGA1 gene (b) with neuroticism and insomnia, respectively. Effects for genetic variants on complex traits (plotted in grey) and gene expression (blue) were available within a 1 Mb distance of the lead variant at each locus, whereas effects on DNA methylation levels (red) were confined to a 5kb distance

