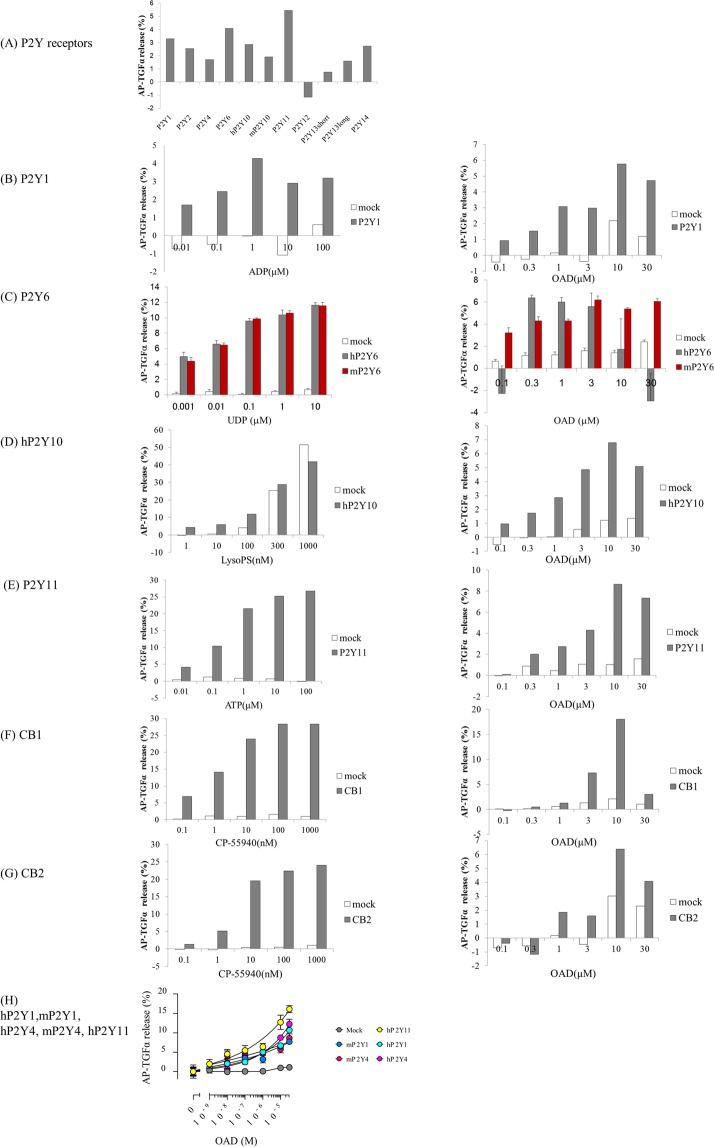
Figure 3.
Improvement in the TGF-α shedding response to OAD in HEK293 cells expressing P2Y1, P2Y4, P2Y6, P2Y10, P2Y11, CB1, and CB2. (A) Summary of the results of the TGF-α shedding response in cells transfected with P2Y receptors during the screening series. Mock transfected cells (pCAGGS empty vector) (white bar) (B–H) or HEK 293 cells expressing GPCRs (left) (P2Y1 (B,H), human P2Y6 (C, dark bar), mouse P2Y6 (B, red bar), P2Y10 (D), P2Y11 (E,H), CB1 (F), CB2 (G), and human and mouse P2Y4 (H)) were treated with OAD (right) or each receptor agonist (left) (ADP (B), UDP (C), LysoPS (D), ATP (E), CP-55940 (F,G)). The TGF-α shedding response was then calculated. Data represent the mean (n = 2) (A,B, D–F), mean ± S.E.M (n = 4) (C), or mean ± S.E.M (n = 3) (H).

