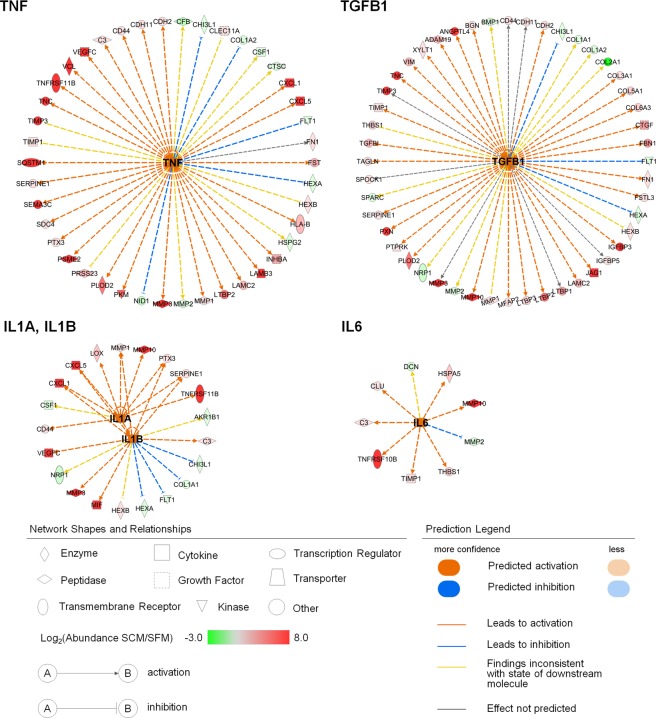
Figure 5.
Upstream regulator analysis of hWJ-MSC secretome. Data illustrate the paracrine factors predicted as upstream regulators and their downstream targets in hWJ-MSC data sets. Activated upstream regulators (z-score ≥ 2) are highlighted in orange at the center of circular diagrams and the downstream targets are arranged along the circumference. Up-regulated and down-regulated proteins in SCM compared to SFM are highlighted in red and green, respectively. Orange and blue dashed lines with arrows indicate predicted direction of activation. Networks for IL1A and IL1B are merged in one network for simplicity.

