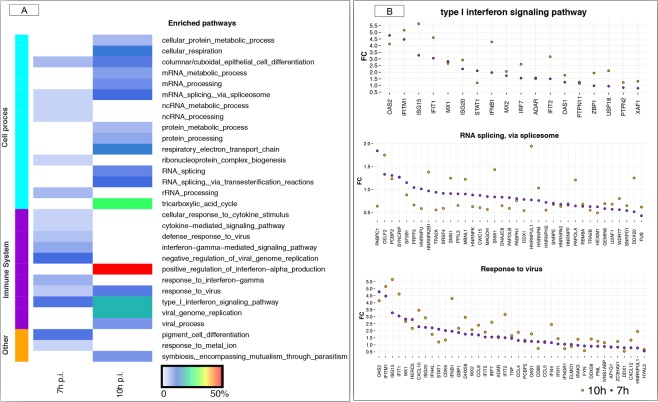
Figure 3.
A functional map of DEGs in the whole cell. (A) The heatmap shows the top categories of enriched GO biological pathways at 7 h p.i. and 10 h p.i., respectively. The cell colours represent the % of DEGs associated with the various pathways. The lateral left colour represents the main biological function associated to each pathway. (B) Fold change representation of genes involved in the three commonly enriched pathways between 7 h and 10 h p.i. in the whole cell. In all plots, violet dots represent 7 h p.i. and orange dots represents 10 h p.i., respectively. Only those genes that were DEG either at 7 h or 10 h p.i. are plotted within the pathway.

