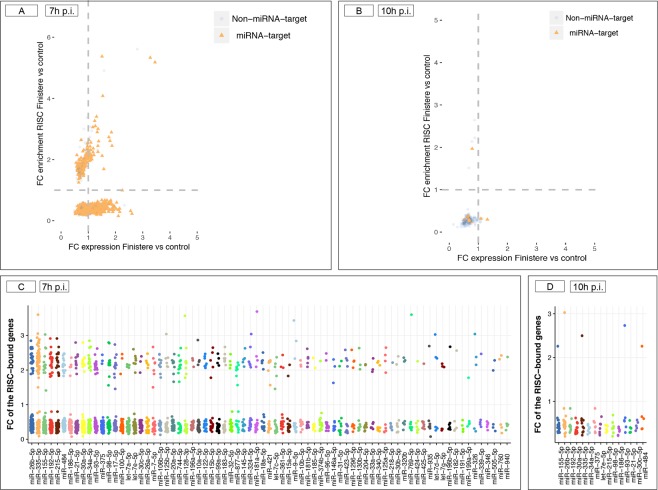
Figure 5.
Putative targets of host miRNAs among enriched/ depleted RISC-bound genes. (A) Representation of putative target genes found within the 1,241 RISC-bound genes at 7 h p.i. The scatter plot depicts changes in mRNA levels in the whole cell (x axis) and in the RISC compartment (y axis). Orange dots indicate genes that are predicted target of at least one miRNA. (B) Same representation as (A) for the 141 RISC-bound genes statistically significant in RISC at 10 h p.i. (C,D) Putative miRNAs regulating the RISC-bound genes at 7 h p.i. and at 10 h p.i. Only miRNAs known to be expressed in alveolar macrophages38 and targeting at least five target genes are shown (x axis). Dots (y axis) represent the FC values of depleted and enriched RISC-bound genes targeted by each miRNA.

