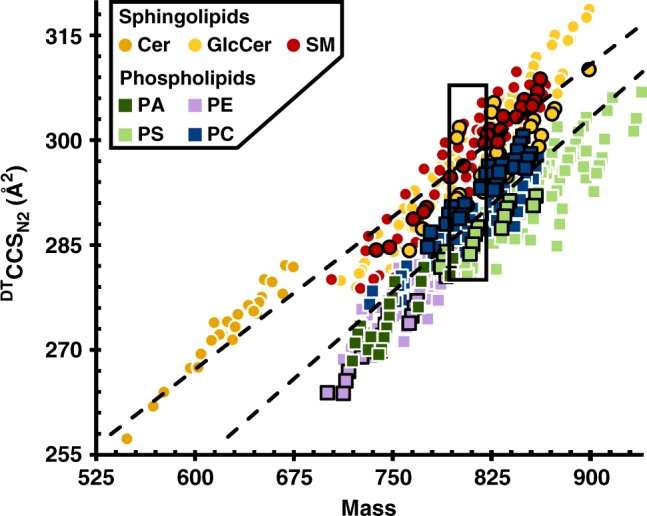
Fig. 2.

Conformational space analysis of all 456 singly charged lipids surveyed in this work. Included are data from 7 classes from 2 lipid categories in positive and negative ionization mode. Markers for cations are indicated by a white border while those for anions are indicated by a black border. Error bars represent standard errors and are for each point within the scale of the marker. Specific lipid identifications, numerical measurement data, and number of measurements per data point (n = 8 or 16 repeat measurements for positive ionization mode data, n = 20, 21, or 28 repeat measurements for negative ionization mode data) are provided in Supplementary Data 1
