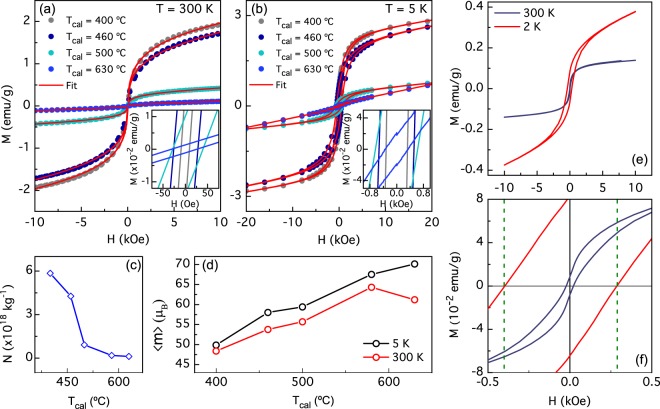
Figure 5.
(a) Magnetic hysteresis loops taken at room temperature and (b) at 5 K of BFO NPs prepared at different calcination temperatures (Tcal). The red line represents the fit using a Langevin equation. (c) Best fitting-parameters for N (number of NPs per mass unit) and (d) m (particle magnetic moment in Bohr magnetons units) with the calcination temperature for M vs. H experimental curves taken at 300 K and 5 K. (e) M vs H hysteresis at 2 K and 300 K curve for a NPs sample calcined at 600 °C. (f) Hysteresis loop zoom; 2 K curve exhibits exchange bias effect.

