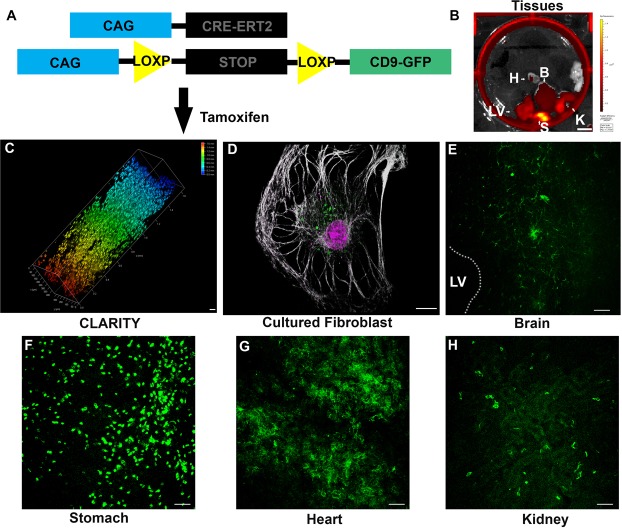
Figure 1.
(A) Schematic of mouse genotype. (B) Image of dissected tissue from CAG-CRE-ERT2 × TIGER mouse cross following 100 μg/g tamoxifen injection at P2 and sacrificed at P4. H, heart, B, brain, LV, liver, S, stomach, K, Kidney. Scale bar, 1 cm. (C) Depth coded volumetric 2 photon microscopy image of CD9-GFP following 100 μg/g tamoxifen injection starting at P2 until sacrifice at P8 in a spleen following CLARITY. Color indicates depth of imaging. Scale bar, 50 μm. (D) Cultured fibroblast treated with tamoxifen from TIGER × CAG-CRE-ERT2 mice. Scale bar, 12.5 μm (E–H) Sections of TIGER × CAG-CRE-ERT2 mouse tissue following 100 μg/g tamoxifen at P2 and sacrificed at P4. (E) Coronal section of TIGER × CAG-CRE-ERT2 mouse near ventricle showing CD9-GFP positive cells. Scale bar, 25 μm. (F) Section of stomach of a TIGER × CAG-CRE-ERT2 mouse. Scale bar, 25 μm. (G) Section of a heart of a CD9-GFP × CAG-CRE-ERT2 mouse. (H) Section of kidney of a TIGER × CAG-CRE-ERT2 mouse. Scale bar, 25 μm.

