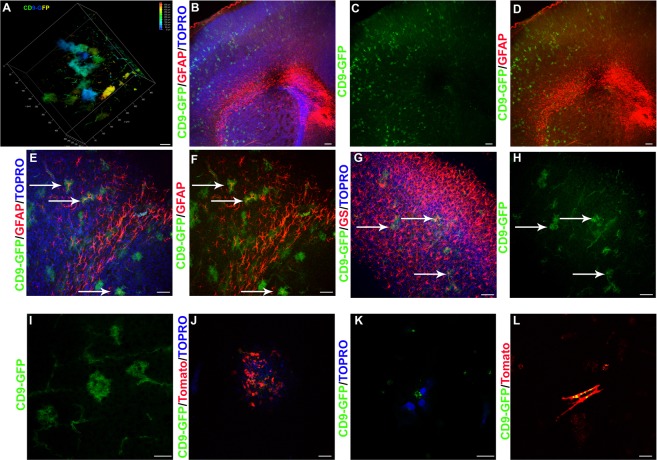
Figure 2.
(A) Depth coded volumetric rendering of cerebral cortex of a TIGER × Nestin-CRE-ERT2 mouse. Scale bar, 50 μm. (B–D) CD9-GFP (green) × CAG-CRE-ERT2 brain sectioned and stained for GFAP (red) and counter-stained with TOPRO (blue) to label nuclei merged (B), CD9-GFP alone (C), and CD9-GFP/GFAP (D). Arrows point to cells with co-localization. Scale bar, 100 μm. (E,F) 20X image of CD9-GFP (green) CAG-CRE-ERT2 brain sections stained for GFAP (red) and counter-stained with (E) or without (F) TOPRO (blue). Arrows point to colocalization. Scale bar, 50 μm. (G,H) Image showing CD9-GFP (green) from TIGER × CAG CRE ERT2 brain sections stained for GS (red) and TOPRO (blue) (G) or CD9-GFP only (H). Arrows points to colocalization. Scale bar, 50 μm. (I) 63X image of cortex demonstrating CD9-GFP in astrocytes. Scale bar, 25 μm. (J) Astrocyte culture from TIGER × Tomato mice electroporated with CRE and counter-stained with TOPRO (blue). Scale bar, 50 μm. (K) Cultured astrocytes from TIGER mice and counter-stained with TOPRO (blue). Scale bar, 12.5 μm. (L) CD9-GFP (green) and tomato (red) electroporated astrocyte cultures to demonstrate morphology. Scale bar, 25 μm.

