Figure 4.
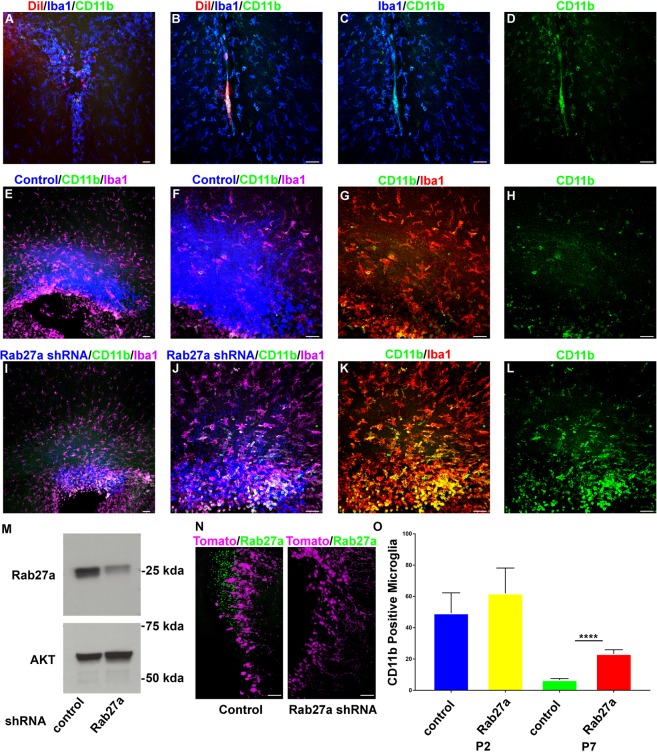
(A–D) Images of coronal brain sections showing DiI (red) labeled EVs taken up by IBA1 (blue) and CD11b (green) positive microglia. (E,F) Tomato and control plasmid (blue) dorsal SVZ electroporations stained for CD11b (green) and IBA1 (magenta) at P7, 10x (E), 20x (F). (G,H) 20x magnification of E showing CD11b (green) and IBA1 (red) (G) or CD11b (H). (I,J) Tomato and Rab27a shRNA plasmid (blue) dorsal SVZ electroporations stained for CD11b (green) and IBA1 (magenta) at P7, 10x (I), 20x (J). (K,L) 20x magnification of I showing CD11b (green) and IBA1 (red) (K) or CD11b (L). (M) Western blot of Rab27a following shRNA mediated knockdown. (N) Images of coronal section stained for Rab27a (green) following control or Rab27a shRNA and tomato (magenta) co-electroporation at P0 and sacrificed 48 hrs later. (O) Quantification of CD11b positive microglia at P2 and P7 following control or Rab27a shRNA electroporation. Data are represented as mean ± SEM. ****p < 0.0001 A, E, I scale bar, 100 μm. B–D, F–H, J–L, N scale bar, 50 μm.

