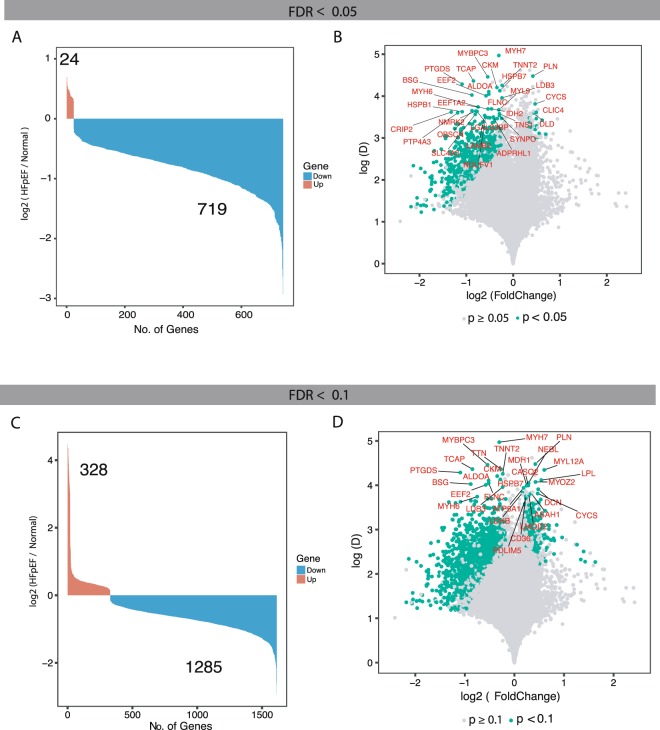
Figure 2.
Identification and annotation of the dysregulated genes in HFpEF proxy versus Normal physiology. (A) Bar plot showing number of differentially expressed genes between HFpEF proxy and Normal physiology predicted using NOISeq with false discovery rate (FDR) adjusted p-value < 0.05. The x axis represents significantly dysregulated genes and the y axis showing the fold change in log2 scale of the corresponding genes. Down-regulated genes in blue and up-regulated genes in orange. (B) Volcano plot of the differentially expressed genes. The x axis represents fold change in log2 scale of HFpEF proxy versus Normal physiology while the y axis indicates the differences of mean expression between HFpEF proxy and Normal physiology. Each point represents a gene, and significantly expressed genes are highlighted in green. Genes that are significantly expressed (FDR-adjusted p-value < 0.05) and with a difference of mean expression above 3.5 are labelled with gene symbols. (C) Similar to plot “A”, but FDR-adjusted p-value < 0.1. (D) Similar to plot “B” but FDR-adjusted p-value < 0.1. Genes that are significantly expressed and with a difference of mean expression above 3.7 are labelled with gene symbols.

