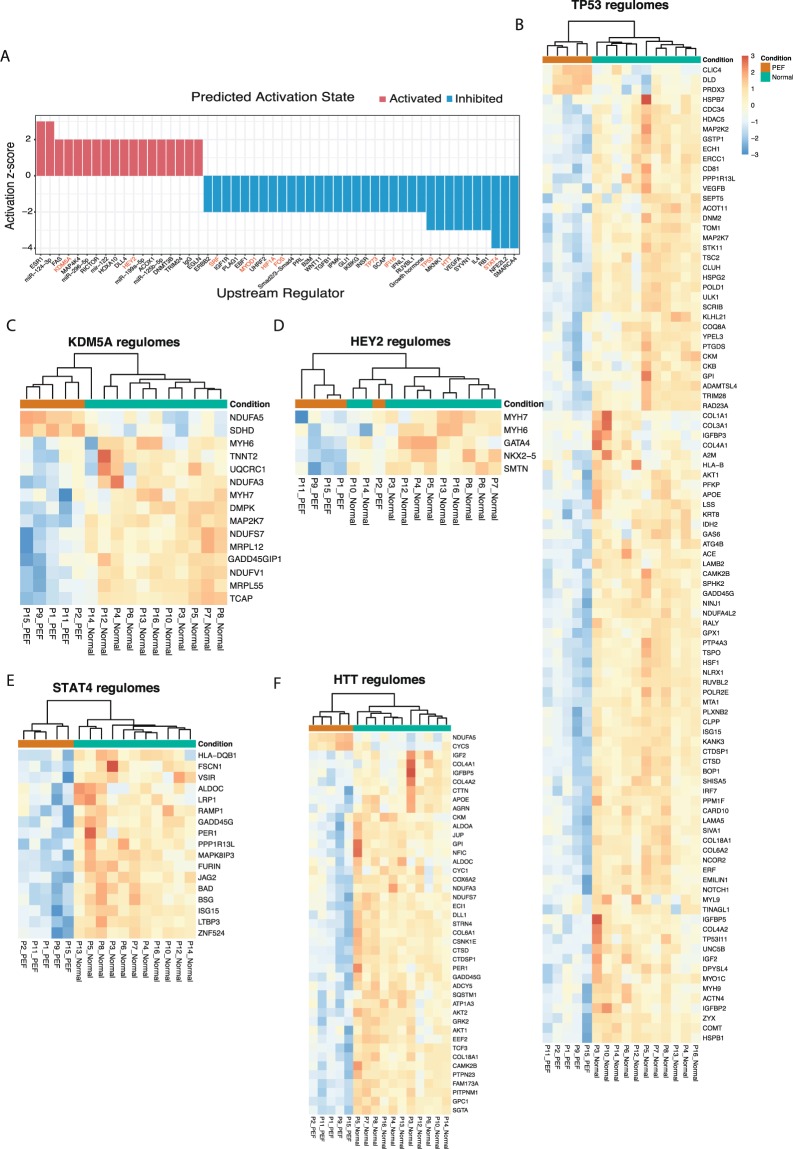
Figure 4.
Predicted upstream regulators and gene expression of their regulomes. (A) Bar plot showing activation or inhibition scores of the upstream regulators. Transcription factors are highlighted in red. (B–F) Heat maps showing the expression profiles of the genes regulated by predicted transcription factors from A. Additional heat maps are shown in Supplementary Fig. S3. Samples in the HFpEF proxy group are coloured orange in Condition, and samples in the Normal physiology group are coloured green. The regulators genes were identified using IPA. Patient numbers and conditions are shown at the bottom of each heatmap.

