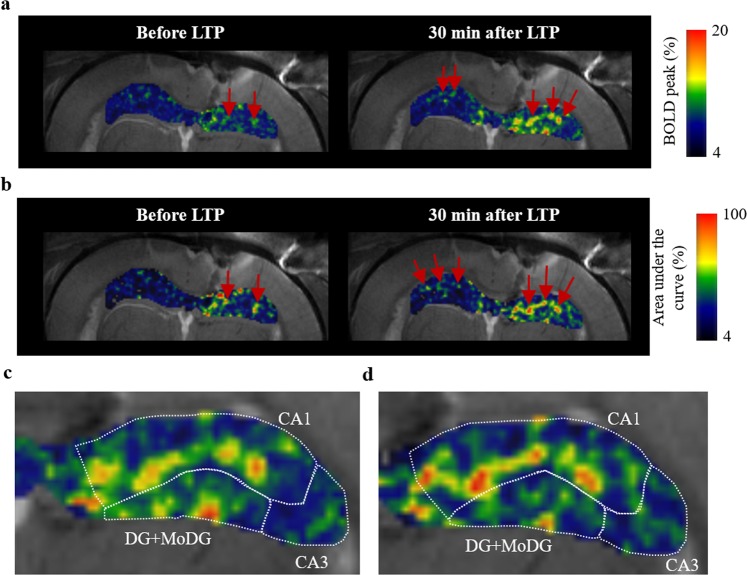
Figure 3.
Maps of BOLD peak and BOLD area under the curve. Maps of BOLD peak intensity (a) and area under the curve (b) before and after LTP induction. The peak intensity and the area under the curve are averages over four stimulation periods. The red arrows point to regions manifesting a significant increase in the BOLD peak intensity or area under the curve at the radiatum layer of CA1. Zoomed images of the BOLD peak map (c) and the area under the curve map (d) within the ipsilateral hippocampus after LTP induction.

