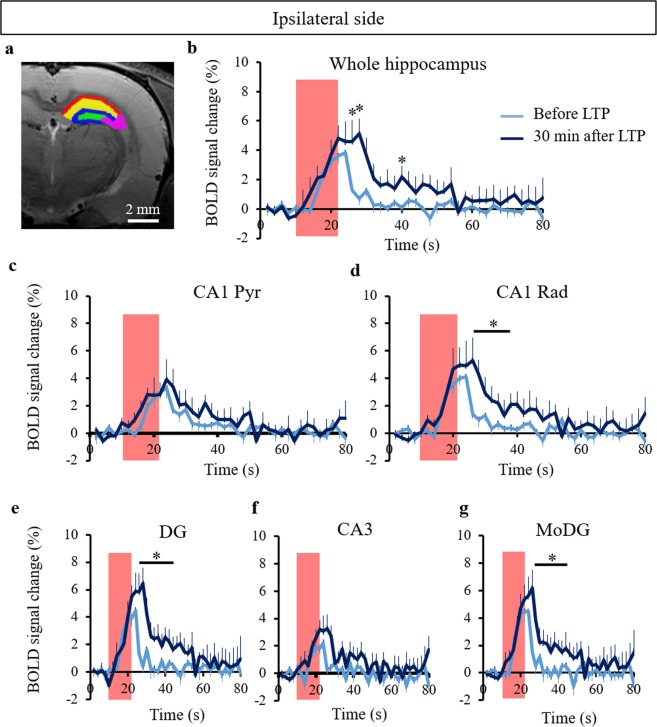
Figure 4.
Time course of the BOLD response in the ipsilateral hippocampus. (a) Color coded ROIs (green: dentate gyrus (DG), purple: CA3, blue: molecular layer of DG (MoDG), yellow: radiatum layer of CA1 (CA1 Rad), and red: pyramidal layer of CA1 overlaid on the T2 weighted structural image. BOLD time courses in the entire ipsilateral hippocampus (b), CA1 Pyr (c), CA1 Rad (d), DG (e), CA3 (f), and MoDG (g) before and after LTP induction. The red boxes correspond to periods of electrical stimulation at the perforant pathway. The bar plots exhibit mean ± sem. *p < 0.05 (paired t-test). The interaction between BOLD time course and LTP effects (two-way repeated ANOVA) showed no significance.

