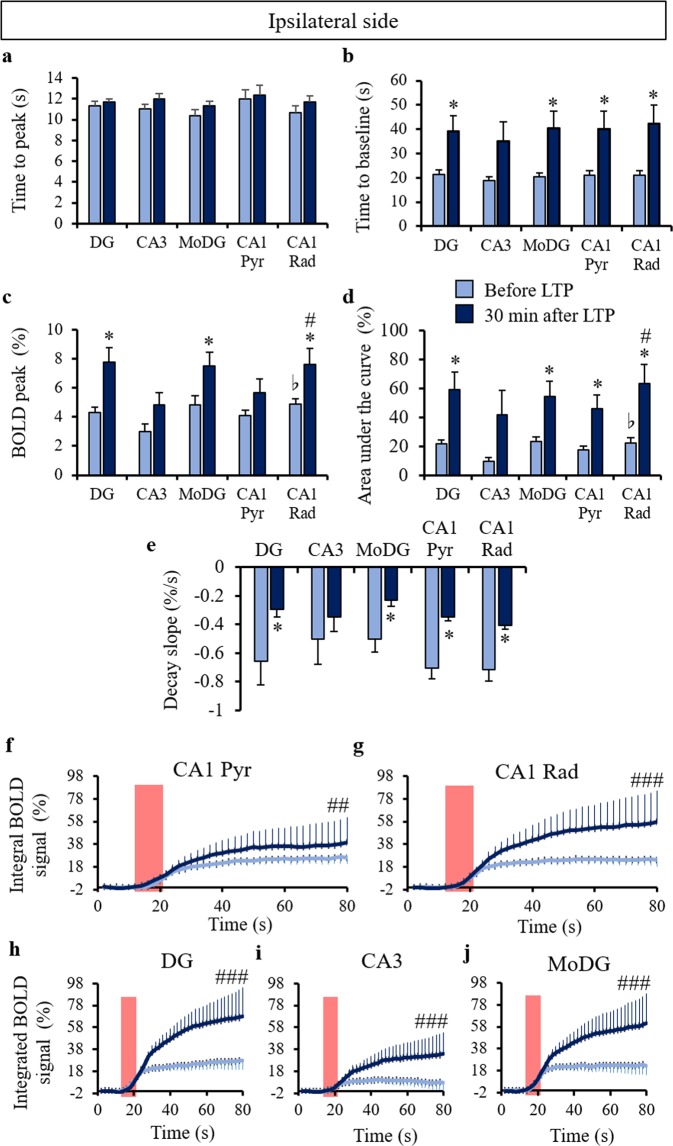
Figure 5.
BOLD response parameters in the ipsilateral hippocampus. The time to peak (a), time to baseline (b), peak intensity (c), area under the curve (d), and decay slope were measured using the same ROIs as in Fig. 4a. *p < 0.05 (paired t-test after versus before LTP at each region), bp < 0.05 (paired t-test Rad versus Pyr before LTP), and #p < 0.05 (paired t-test Rad versus Pyr 30 min after LTP). The integrated BOLD responses shown at CA1 Pyr (f), CA1 Rad (g), DG (h), CA3 (i), and MoDG (j) before and after LTP induction. The red boxes represent electrical stimulation periods at the perforant pathway. ##p < 0.01, ###p < 0.001 (LTP effect of the two-way repeated ANOVA). The bar plots exhibit mean ± sem.

