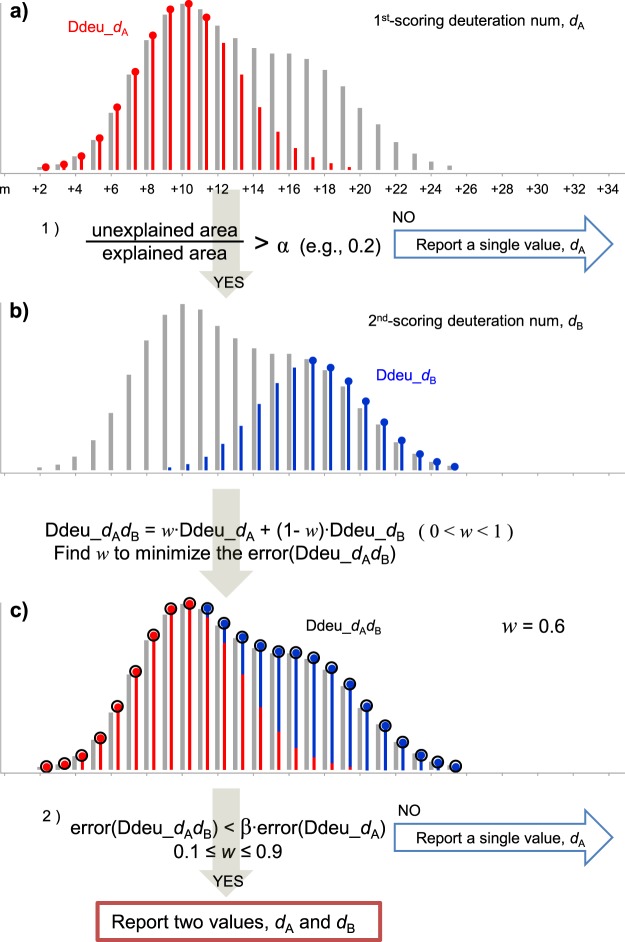
Figure 6.
Bimodal distribution analysis. (a) After the initial unimodal distribution analysis, it is assessed how well the observed distribution is explained. (b) If a significant portion is not explained, the next bimodal distribution analysis is performed, where weights of the two distributions are optimized. (c) After bimodal distribution analysis, it is assessed how much the error is improved and whether both distributions are all fairly abundant. Only if all criteria are satisfied, two deuterium numbers are reported.

