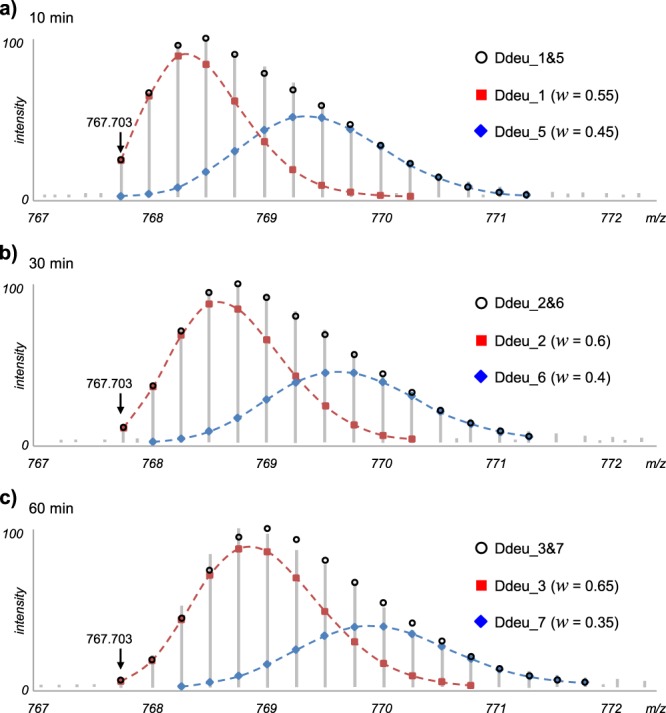
Figure 7.

Deuterated distributions of the peptide ‘IAIKPDGVQRGLVGEIIKRFEQKGFRL’ from the oxidized protein at the same retention time with different D2O labeling times. The distributions could not be fitted properly using a unimodal distribution, and deMix analyzed them as bimodal forms, whose theoretical distributions (shown as black circle) are well-fitted to their observed distributions. w represents relative amount of each component peptide species (shown as red rectangle and blue diamond).
