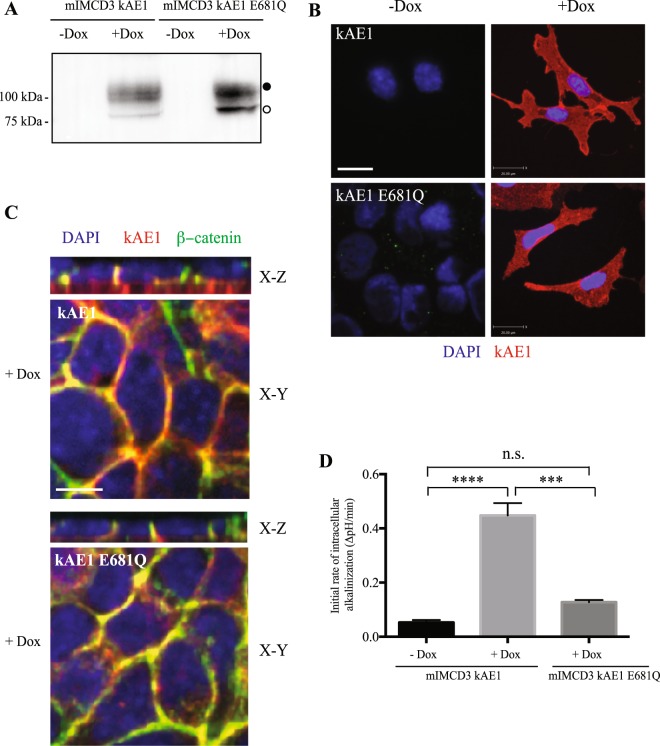
Figure 2.
kAE1 E681Q mutant reaches the plasma membrane but is inactive. (A) Immunoblot of mIMCD3 cells either expressing kAE1 WT or E681Q mutant. Both proteins are expressed at comparable levels and both carry complex (black circle) and high mannose (white circle) oligosaccharides. (B) mIMCD3 cells stably expressing kAE1 WT or E681Q mutant were grown on glass coverslips and incubated with doxycycline to induce kAE1 protein expression. Cells were then immunostained with an anti-HA antibody followed by Cy3 coupled secondary antibody (red). Blue staining corresponds to nuclear localization with DAPI. Bar = 20 μm. (C) mIMCD3 cells stably expressing kAE1 WT or E681Q mutant and incubated with doxycycline (+Dox) were grown on semi-permeable filters, fixed, permeabilized and incubated with rabbit anti-β-catenin (green) and mouse anti-HA antibodies (red). Nuclei were stained with DAPI (blue). X-Y shows a middle section through the cells, X-Z shows a side view of the cells. Bar = 10 μm. (D) Functional assay using pH-sensitive fluorescent probe BCECF on either mIMCD3 cells stably expressing kAE1 WT without doxycycline (mIMCD3 kAE1 - Dox), with doxycycline (mIMCD3 kAE1 + Dox) or kAE1 E681Q with doxycycline (mIMCD3 kAE1 E681Q + Dox). Error bars correspond to means ± SEM, n = 3. ***P < 0.001 versus “mIMCD3 kAE1 + Dox” condition, ****P < 0.0001 versus “mIMCD3 kAE1 - Dox” condition, n.s. indicates no significant difference with “mIMCD3 kAE1 – Dox” condition using one-way ANOVA.

