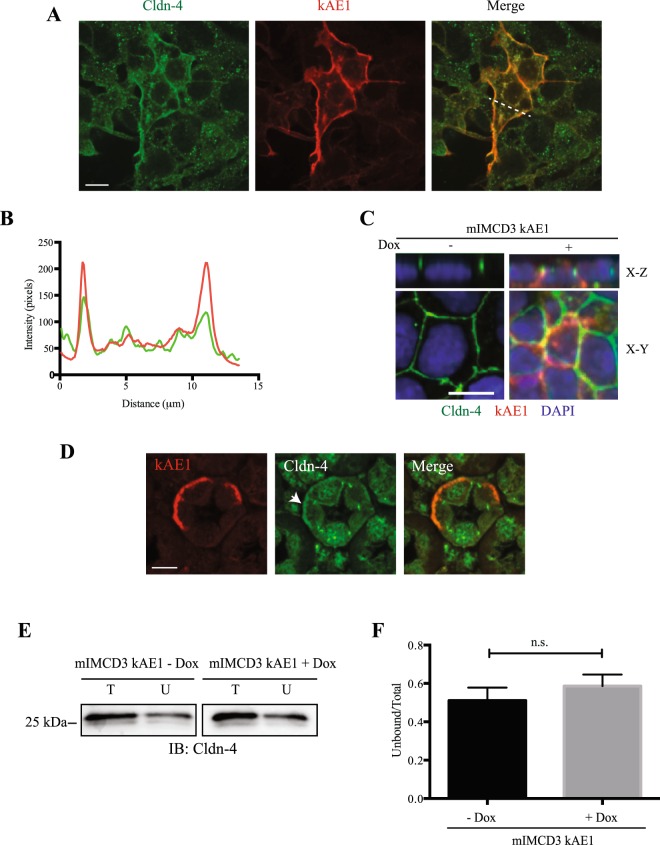
Figure 5.
Claudin-4 colocalizes with kAE1 at the plasma membrane of mIMCD3 cells and in murine intercalated cells. (A), sub-confluent mIMCD3 cells expressing kAE1 were grown on glass coverslips, and incubated with doxycycline to induce kAE1 protein expression. Cells were then immunostained with an anti-HA antibody followed by Cy3 coupled secondary antibody (red) and anti-claudin-4 antibody (green). Bar = 20 μm. (B) Quantification of fluorescence intensities in the green and red channels along the dotted line shown in A (right panel), highlighting an enrichment of claudin-4 at the plasma membrane in non-polarized mIMCD3 cells. (C) mIMCD3 kAE1 cells were grown on semi-permeable filter for 10 days prior to immunostaining with anti-HA (red) and anti-claudin-4 (green) antibodies. Nuclei were stained with DAPI (blue). X-Y shows a middle section through the cells, X-Z shows a side view of the cells. Bar = 10 μm. (D) Mouse kidney sections were immunostained with anti-AE1 antibody (red) and anti-claudin-4 (green). Arrowhead indicates that in addition to its junctional localization, claudin-4 is detectable at the basal membrane of kAE1-positive intercalated cells of the renal collecting duct. (E) Cell surface biotinylation performed on polarized mIMCD3 kAE1 cells ± Dox. Total (T) and unbound (U) claudin-4 are shown. (F) quantification of the cell surface biotinylation results (U/T ratios), showing that there is no significant difference in the amount of cell surface claudin-4 upon kAE1 expression in polarized cells. Error bars correspond to means ± SEM, n = 7. n.s. indicates no significant (n.s.) difference with “mIMCD3 kAE1 – Dox” condition using un-paired t-test.

