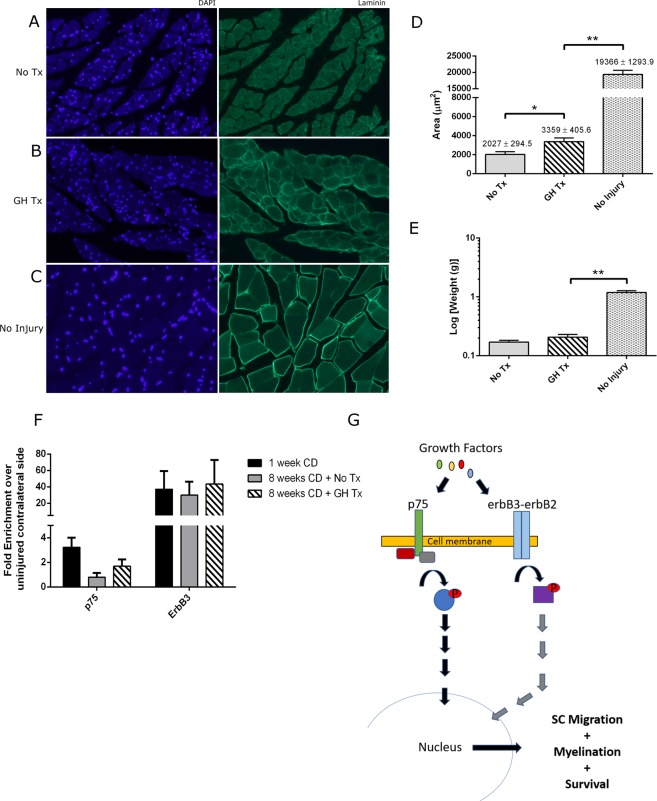
Figure 4.
GH therapy reduces muscle atrophy but does not augment SC proliferation after 8 weeks of treatment. (A–C) Representative confocal images (20x) of gastrocnemius muscle fibers immunostained for DAPI (blue) and laminin (green). (D) Quantification of the cross-sectional muscle area (E) Quantification of gastrocnemius muscle weight. (F) SC expression of p75 and erbB3. Expression levels were determined by RT-PCR analyses in mRNA prepared from SC extracted from nerves in experimental and control groups. All expression levels were calibrated to the animal’s contralateral naïve (non-injured) sciatic nerve. TBP was used as the housekeeping gene. (G) Visual representation of the molecular pathways activated by cell surface receptors, erbB and p75, and their involvement in SC proliferation and activation. Bars represent standard error. *p < 0.05, **p < 0.001. Abbrev: GH = growth hormone; SC = Schwann cells.

