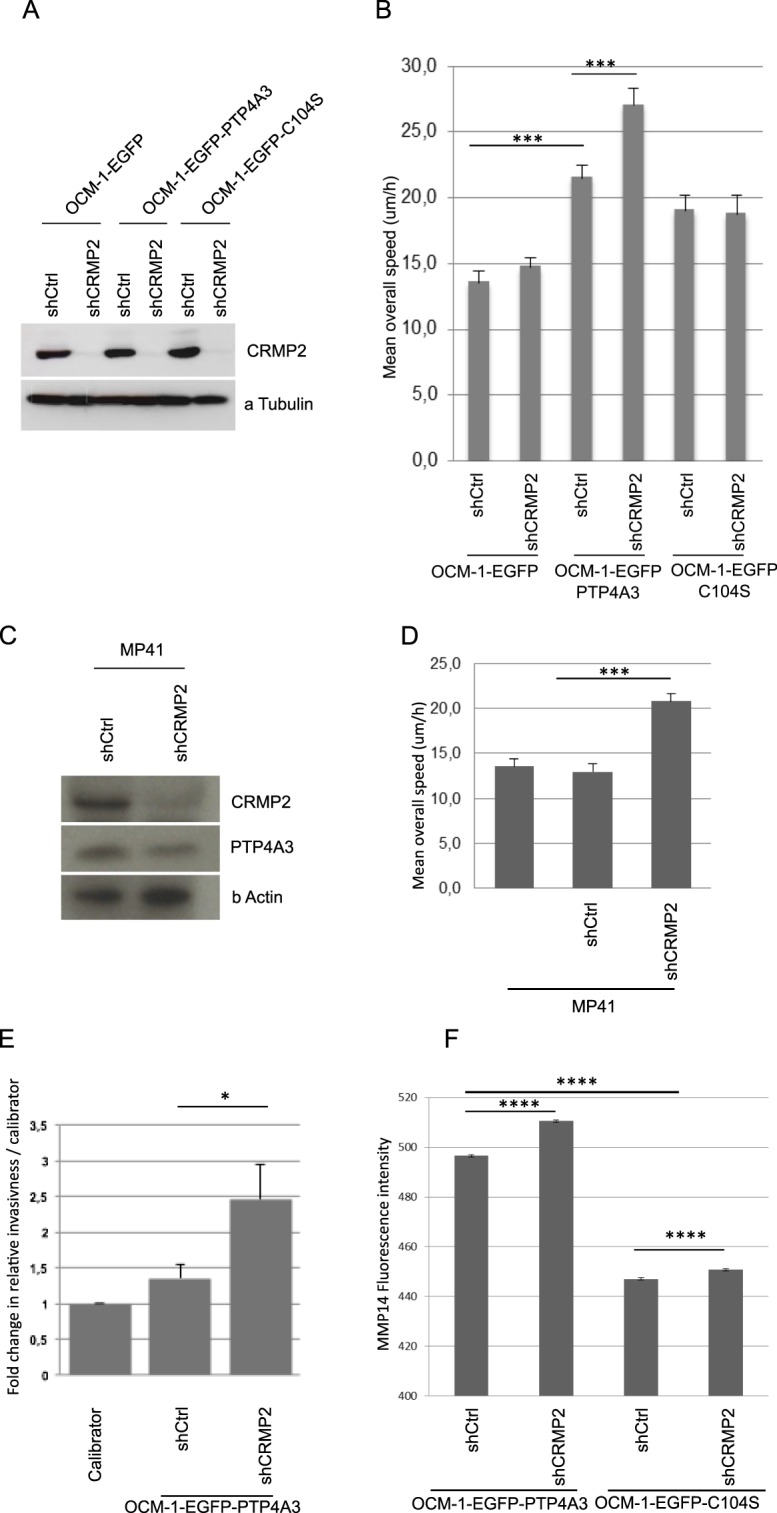
Figure 3.

CRMP2 expression downstream of PTP4A3 reduces cell migration and invasiveness. (A) Western blot showing the knockdown of CRMP2 in OCM-1 cells expressing EGFP, EGFP-PTP4A3, or EGFP-C104S. Twenty micrograms of protein extract was loaded. The detection of α-tubulin was performed as a loading control. (B) The mean overall speed of OCM-1 cells was assessed by a 2D random cell migration assay by time-lapse video microscopy. Data are shown as the mean values +/− SD. ~100 cells were tracked per condition. ***p < 0.001, Student’s t-test. (C) Western blot showing the knockdown of CRMP2 in human PDX-MP41 cells and endogenous expression of PTP4A3. Twenty micrograms of protein extract was loaded. The detection of β-actin was performed as a loading control. (D) The mean overall speed of MP41 cells was assessed by a 2D random cell migration assay by time-lapse video microscopy. Data are shown as the mean values +/− SD. ~100 cells were tracked per condition. ***p < 0.001, Student’s t-test. (E) Quantitative analysis of the relative invasiveness of EGFP-PTP4A3shCtrl and EGFP-PTP4A3shCRMP2 cells. Cells (0.25 × 10⁶) were inoculated into the CAM of chick embryos and the presence of human cells assessed by real-time PCR analysis of chick GAPDH and human alu sequences in the chick femur DNA. Values for the calibrator were arbitrarily defined as 1. The graphs show the means +/− SD. *P < 0.05 (embryos n = 14/cell line), Student test. (F) MMP14 localization on the cell surface assessed by flow cytometry of nonpermeabilized OCM-1 cells. n > 8000 cells analyzed, (****p < 0.0001), Student test.
