Figure 4.
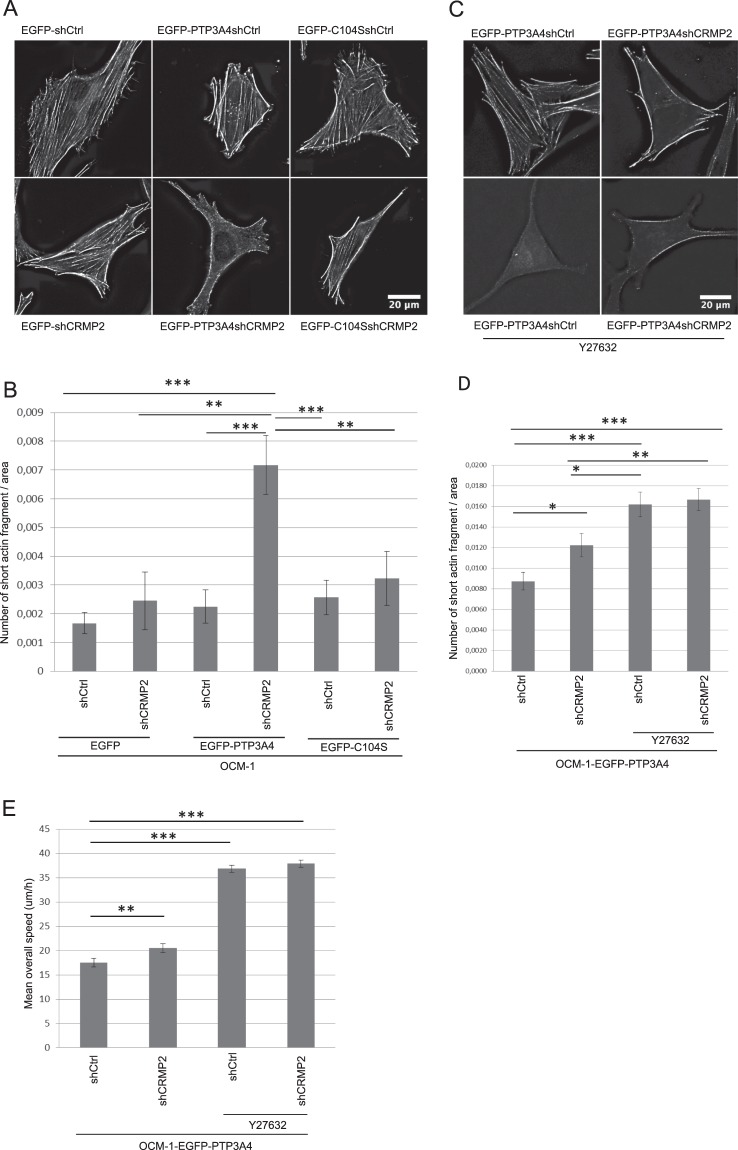
CRMP2 affects the actin network. (A) Visualization of the actin cytoskeleton network in OCM-1 cells as assessed by Phalloïdin staining. After deconvolution, images were processed using ImageJ64. Scale bar = 20 μm. (B) Quantification of the number of fragments of < 40 adjoining pixels normalized to the cell area in OCM-1 cells. Data are shown as the mean values +/− SEM. ~20 cells were analyzed. ***p < 0.001, **p < 0.01, Student’s t-test. (C) Visualization of the actin cytoskeleton network in OCM-1 cells as assessed by Phalloïdin staining of cells treated with Y27632 for 24 h. After deconvolution, images were processed using ImageJ64. Scale bar = 20 μm. (D) Quantification of the number of fragments of < 40 adjoining pixels normalized to the cell area in OCM-1 cells treated or not with Y27632. Data are shown as the mean values +/− SEM. ~60 cells were analyzed. ***p < 0.001,*p < 0.01, *p < 0.05, Student’s t-test. (E) The mean overall speed of OCM-1 cells treated with Y27632 as assessed by a 2D random cell migration assayed by time-lapse video microscopy. Data are shown as the mean values +/− SD. ~100 cells were tracked per condition. ***p < 0.001, **p < 0.01, Student’s t- test.

