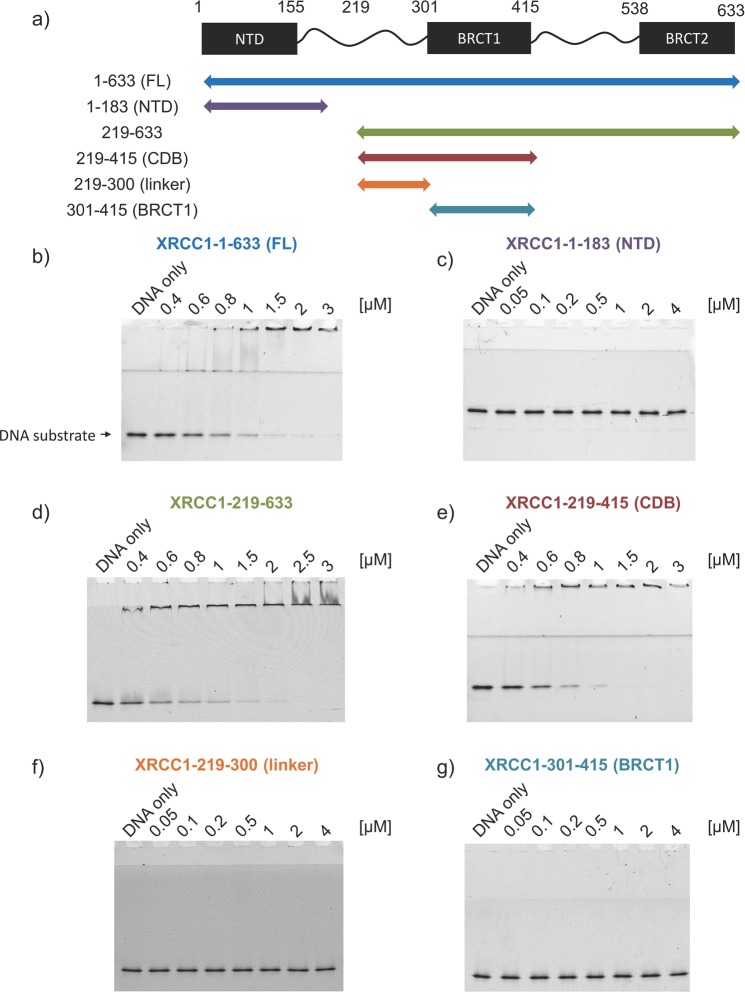
Figure 1.
Comparison of DNA binding activities of XRCC1 truncations. (a) Domain organization of XRCC1 with truncation boundaries indicated by arrows: Full length (blue), 1–183 (purple), 219–633 (green), 219–415 (red), 219–300 (orange) and 301–415 (cyan). (b–g) DNA binding activity of XRCC1 truncations (µM concentrations) monitored by electrophoretic mobility shift using fluorescent 39 bp duplex DNA. Discontinuous PAGE was used to facilitate band resolution. Full length gels are in Supplementary Fig. 13.

