Figure 2.
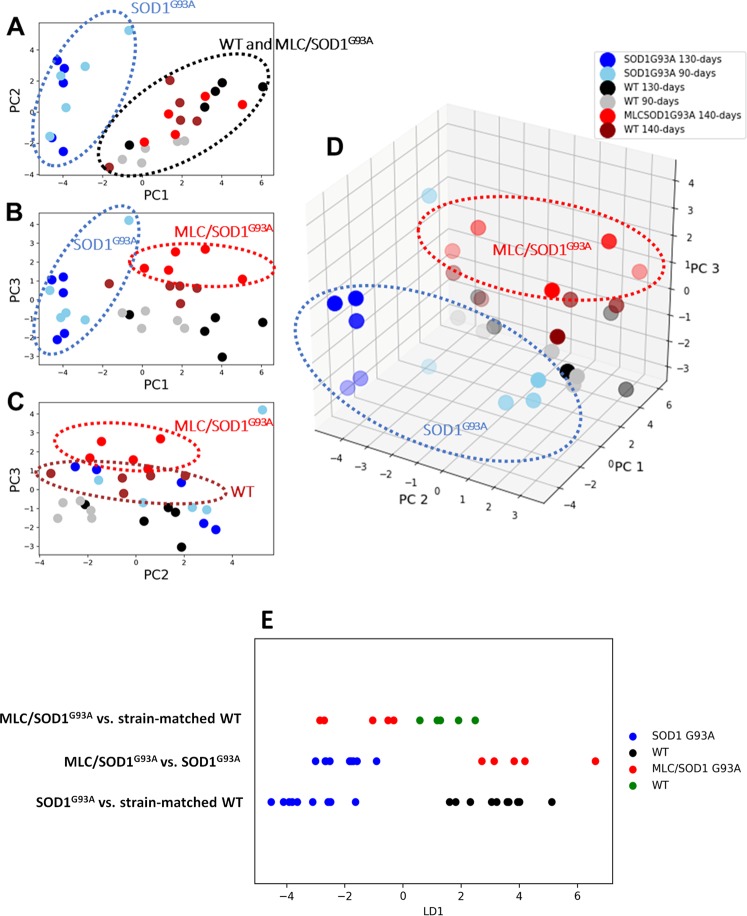
Principal Component Analysis (PCA) and Linear Discriminant Analysis (LDA) of PCA scores. Scatterplot of PC score onto the first three selected PC. In (A) are shown PC score on PC1 and PC2, in (B) of PC1 and PC3, in (C) of PC2 and PC3, as 2-dimensional graphs. In (D) a 3-dimensional scatterplot of the same PC scores. Each dot represents the intersection of PC scores of the animal muscles (n = 30) onto PC1, PC2 and PC3. PC score are linear combinations of initial gene expression values of target genes and their corresponding loading weights in the considered PC. (E) Linear scatter-plots showing the results of the 3 Linear Discriminant Analysis (LDAs) of the first three PC scores. Red dots are MLC/SOD1G93A muscles Linear Discriminant (LD) scores, green dots are the strain-matched WT LD scores, blue dots are SOD1G93A LD scores and black dots strain-matched WT LD scores. On the top was showed the first LD, that better separates red and green dots representing MLC/SOD1G93A and their WT, respectively. In the middle part, LD that better separates MLC/SOD1G93A and SOD1G93A muscles, shown as red and blue dots, respectively. On the bottom, LD that better separates SOD1G93A and their WT, shown as blue and black dots, respectively.

