Figure 5.
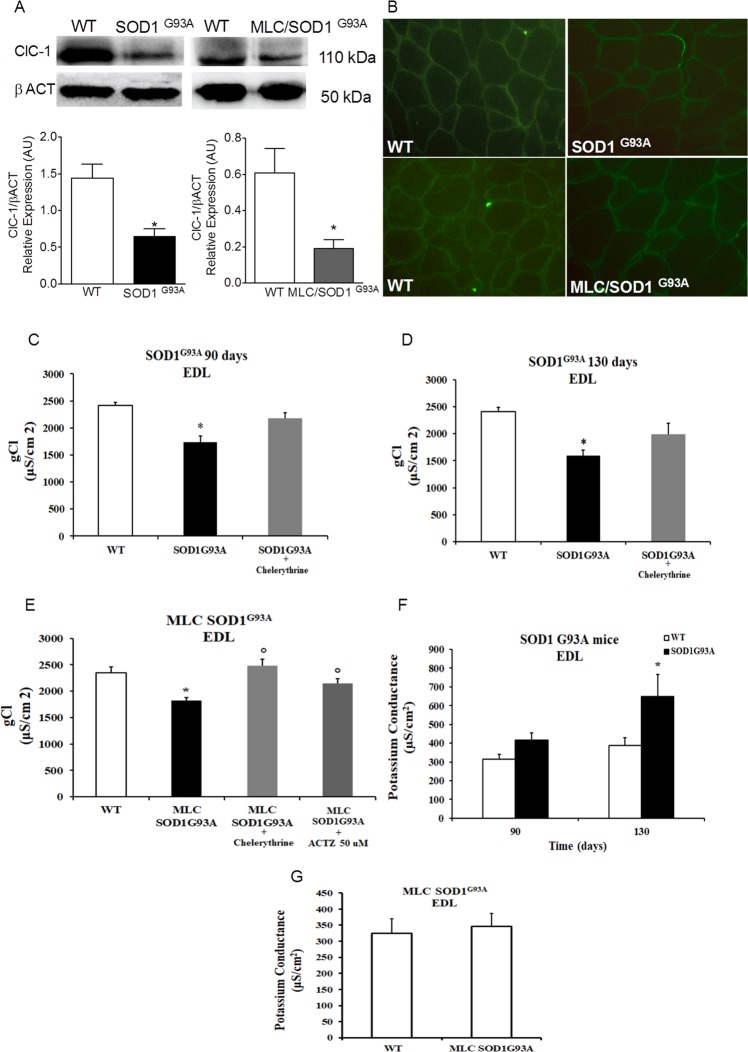
ClC-1 chloride channel expression and activity in MLC/SOD1G93A and SOD1G93A mice. (A) Representative Western blot showing the expression level of ClC-1 protein in TA muscle tissue of SOD1G93A and MLC/SOD1G93A mice. The blots were reacted with specific antibodies. β-actin was used to normalize the blot. Gel images are cropped from the blot shown in the Supplementary Figs S7 and S8. Histograms show quantification of relative protein levels calculated by normalization of the absolute intensity of target protein with the absolute intensity of β-actin, as reference standard, and are represented as arbitrary units (AU). Each bar represents the mean ± SEM from five muscles.* Significantly different with respect to WT (at least P < 0.05) by Student’s t-test. (B) Immunofluorescence assay in TA muscle of MLC/SOD1G93A and WT mice and in Gastrocnemius muscle of SOD1G93A mice and WT. The presence of ClC-1 protein in muscle section was shown by specific antibodies. The images are 20X magnification. (C-G) The component ionic conductances measured in EDL muscle of SOD1G93A and MLC/SOD1G93A animals. Values are expressed as mean ± S.E.M. from five animals for each experimental condition (10–46 fibers were analyzed in each group of animals). (C,D) The macroscopic Chloride Conductance (gCl) measured in EDL muscles fibers of SOD1G93A animals at the two selected ages and effects of the in-vitro application of chelerythrine (1 µM). Statistical analysis was performed using one-way ANOVA followed by Bonferroni post-hoc t-test (F = 15.8, df = 2, P < 0.0001, for gCl in SOD1G93A at 90-days) (F = 16.6, df = 2, P < 0.0001 for gCl in SOD1G93A at 130-days). *Significantly different vs. age-matched WT (at least P < 0.05). (E) Macroscopic gCl measured in EDL muscles fibers of MLC/SOD1G93A animals and effect of in-vitro application of Chelerythrine (1 µM) or Acetazolamide (ACTZ, 50 µM). Statistical analysis was performed using one-way ANOVA followed by Bonferroni post-hoc t-test (F = 12.5, df = 3, P < 0.0001, for gCl in MLC/SOD1G93A). *Significantly different vs. age-matched WT (at least P < 0.05). °Significantly different vs. MLC/SOD1G93A (at least P < 0.05). (F) The macroscopic Potassium Conductance (gK) measured in EDL muscles fibers of SOD1G93A animals at the two selected ages (F = 5.18, df = 3, P < 0.005, for gK in SOD1G93A). *Significantly different vs. age-matched WT (at least P < 0.05). (G) The macroscopic gK measured in EDL muscle of MLC/SOD1G93A mice (no significant differences were found).

