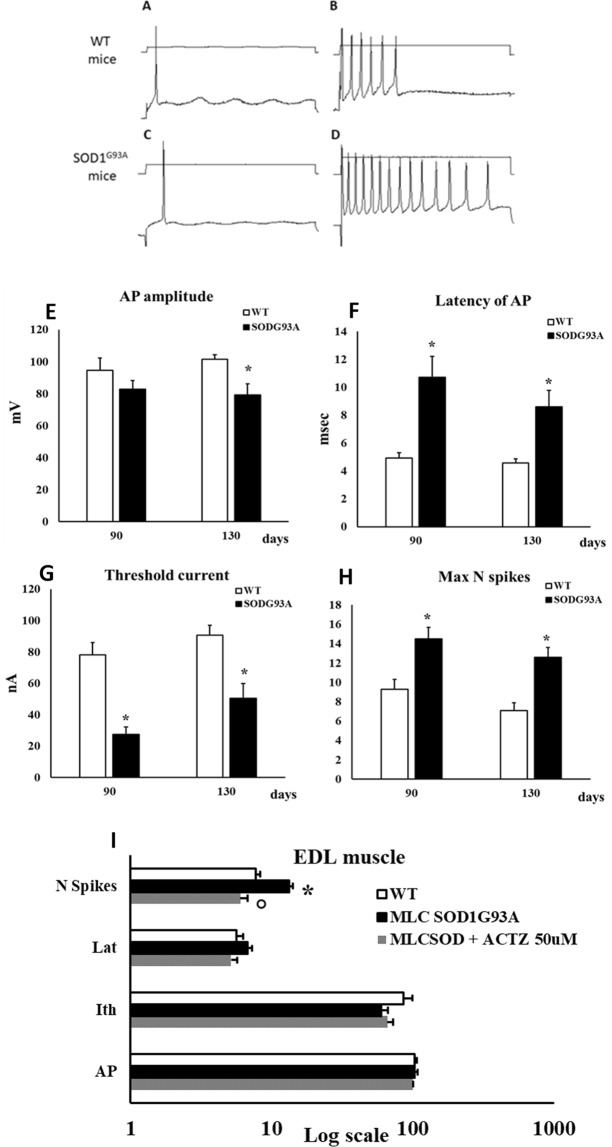
Figure 6.
Sarcolemma excitability parameters measured in EDL muscle of SOD1G93A and MLC/SOD1G93A animals. (A–D) Representative traces of the Action Potential (AP) recorded in EDL muscle fibers by standard two microelectrodes technique at 0.05 mm distance between electrodes, in response to depolarizing square-wave current pulse. (A,B) images showed traces recorded in EDL fibers of WT animals. (C,D) showed the traces recorded in SOD1G93A mice. On the left, it has been used a minimal squared-wave current pulse to elicit the single AP. On the right it has been used the minimum pulse to elicit the maximum number of spikes. (E–H) Excitability parameters of EDL muscle fibers of SOD1G93A animals at 90 and 130 days of age. Values are expressed as mean ± S.E.M from 10–16 fibers. In (A) the AP amplitude, in (B) the latency time of AP, in (C) the threshold current needed to elicit a single AP (Ith) and in (D) the maximum number of elicitable spikes (Max N spikes). Statistical analysis was performed using one-way ANOVA followed by Bonferroni post-hoc t-test (F = 3.8, df = 3, P < 0.02 for AP; F = 10.06, df = 3, P < 0.0001, for Lat; F = 18.2, df = 3, P < 0.0001, for Ith; F = 8.1, df = 3, P < 0.0001 for N spikes). *Significantly different vs. age-matched control group (at least P < 0.05). (I) Excitability parameters of EDL muscle fibers of MLC/SOD1G93A animals. Values are expressed as mean ± S.E.M. from 10–20 fibers. The excitability parameters were recorded in the absence and in the presence of 50 µM ACTZ. To note, because of the Log scale, the measure units are omitted and are: for Action Potential amplitude (AP) mV; for the threshold current amplitude (Ith) nA; for the latency of AP (Lat) msec; and for the maximum number of elicitable AP (N spikes). Statistical analysis was performed using one-way ANOVA followed by Bonferroni post-hoc t-test (F = 26.86, df = 2, P < 0.0001, for N spikes). *Significantly different vs. WT (P < 0.05) °Significantly different vs. MLC/SOD1G93A (P < 0.05).

