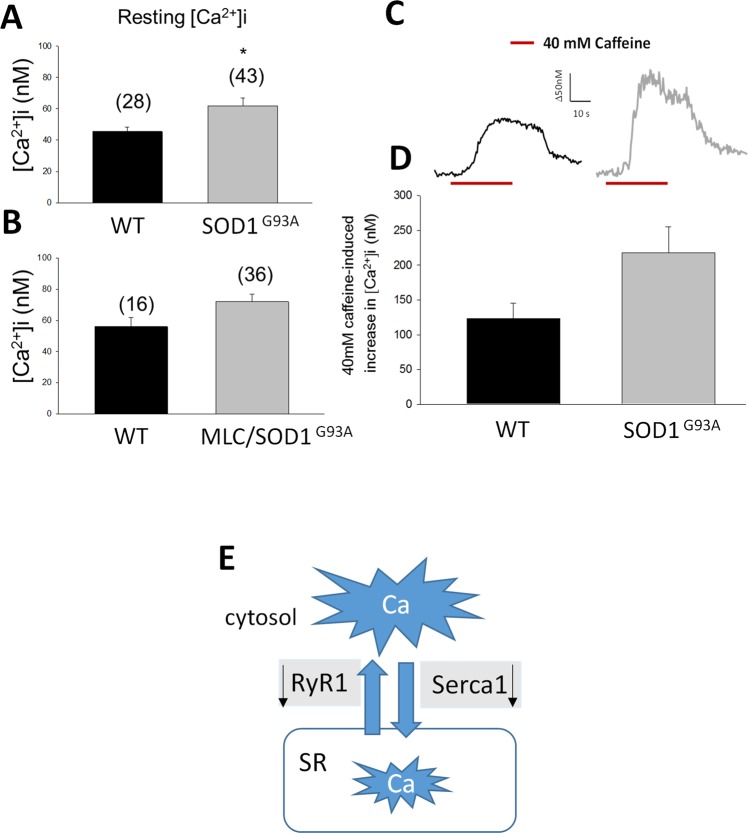
Figure 8.
Cytosolic resting calcium (restCa) level in EDL muscle fibers measured by FURA-2 cytofluorimetric technique. RestCa level measured in (A) 130 days-old SOD1G93A animals and in (B) 140 days-old MLC/SOD1G93A animals. *Significantly different with respect to WT animals (P < 0.05 by Unpaired Student t-test). (C) Representative traces showing a 40 mM caffeine-induced increase of restCa in WT (black trace) and in SOD1G93A (gray trace) mice. (D) Correspondent barplot constructed using the mean values ± S.E.M. obtained from 15–20 fibers. (E) Schematic representation of the decreased expression of RyR1 and SERCA1 mRNA (black arrows) responsible for the cytosolic calcium increase. Although the decreased expression of RyR in SOD1 G93A may indicate the reduction of Ca flux from SR to the cytosol, SERCA reduction slow down the reuptake in the SR. Slight modification in restCa level were observed in MLC/SOD1G93A animals in line with the lack of changes in RyR and SERCA expression.

