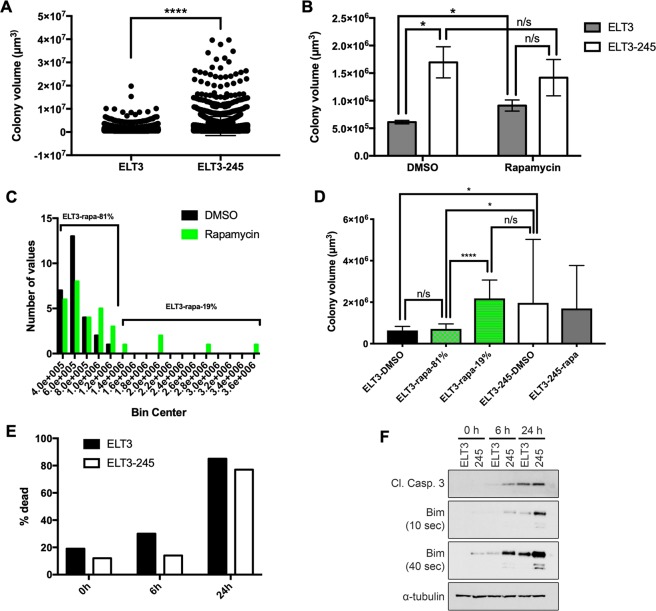
Figure 2.
ELT3-245 cells exhibit enhanced anchorage-independent cell growth and resistance to anoikis. (A) Automatic particle analysis of colonies from soft agar assay. ELT3-245 cells formed significantly bigger colonies, compared to ELT3 cells (****P < 0.0001). (B) 24 hours after plating ELT3 and ELT3-245 cells in soft agar, cultures were continuously treated with 20 nM rapamycin for 3 weeks. Rapamycin treatment did not cause a significant reduction in colony volume in ELT3-245 cells, compared to DMSO. However, rapamycin caused a significant increase in colony volume in ELT3 cells (*P = 0.0148). (C) A subset of ELT3 cells are rapamycin-resistant. Volume distribution of DMSO- and rapamycin-treated parental ELT3 in soft agar. Approximately 19% of rapamycin-treated ELT3 colonies were bigger than DMSO-treated ELT3 colonies. (D) The top 19% of rapamycin-treated ELT3 colonies were significantly bigger, compared to the bottom 81% of rapamycin-treated ELT3 colonies (P < 0.0001). The top 19% of rapamycin-treated ELT3 colonies were not significantly bigger, compared to DMSO-treated ELT3-245 colonies (P > 0.05). (E) ELT3 and ELT3-245 cells were grown in non-adherent condition for 6 and 24 hours, harvested and the percentage of dead cells was counted by trypan blue exclusion. 0 h indicates percentage of dead cells immediately after trypsinization and resuspension in growth media. (F) Immunoblotting of lysates from cells grown in suspension conditions for 0, 6 and 24 hours from panel E. Full-length blots are presented in Supplementary Fig. 6.

