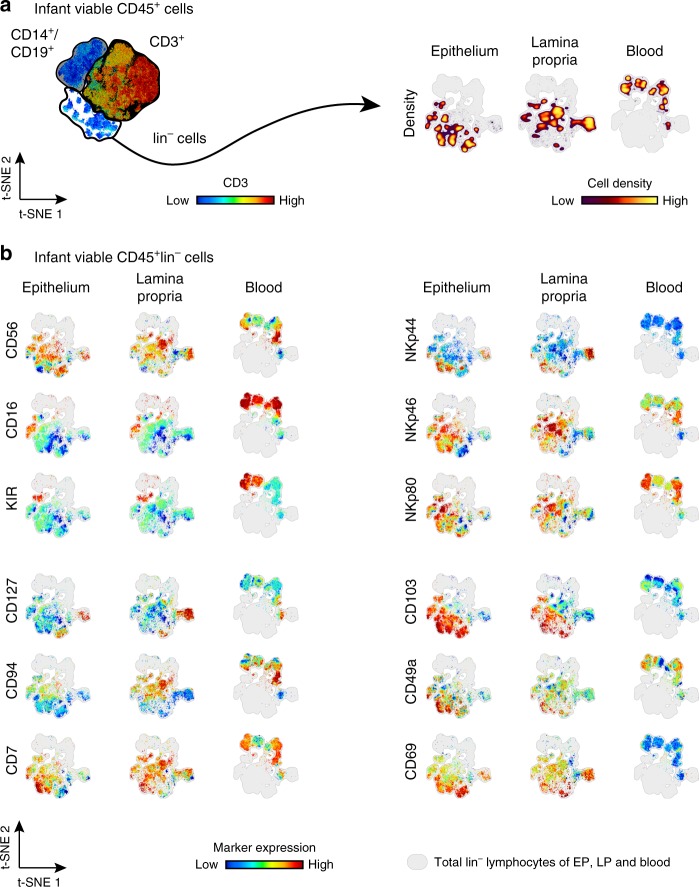
Fig. 1.
Hallmarks of ILCs by infant blood and intestinal CD45+lin− cells. a viSNE plot of flow cytometric analysis of viable CD45+ cells showing separate clustering by tissue of origin: epithelium (EP), lamina propria (LP), and blood (B). b Individual representation of hallmarks of ILCs (CD56, CD16, KIR, CD127, CD94, CD7, NKp44, NKp46, NKp80, CD103, CD49a, and CD69) using viSNE algorithm of flow cytometric data of lin−(CD14−CD19−CD3−) cells for EP, LP, and blood samples. Expression is shown by color coding in relative intensity. viSNE plots have been calculated from concatenated FCS files gated on viable CD45+ lymphocytes from epithelium, lamina propria, and blood of matched donors (N = 4, iterations = 7500 perplexity = 100, KL divergence = 2.15)

