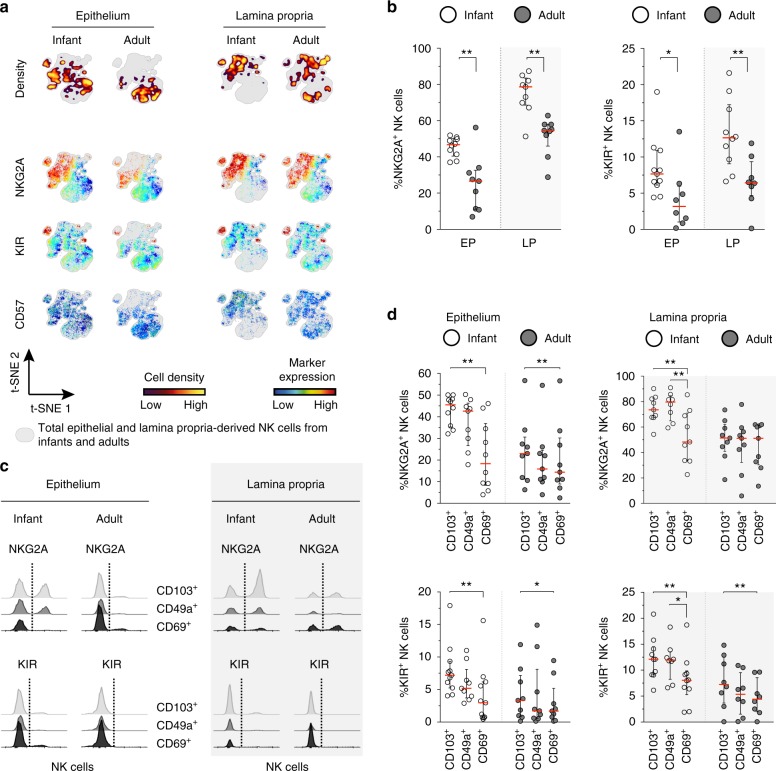
Fig. 4.
Infant intestinal NK cells have high NKG2A expression. a viSNE plots of combined flow cytometric data visualizing NKG2A, KIR, and CD57 expression by infant and adult epithelial (EP) and lamina propria-derived (LP) NK cells. Cell density of clusters is shown in first row. The expression of NKG2A, KIR, and CD57 is shown by color coding in relative intensity below. viSNE plots are calculated from concatenated FCS files gated on NK cells (infant samples N = 9, adult samples N = 6, iterations = 7500 perplexity = 100, KL divergence = 2.29). b Frequencies of epithelial and lamina propria-derived infant (white circles) and adult (dark circles) NKG2A+ NK cells and KIR+ NK cells (EP infant samples NKG2A (N = 10), KIR (N = 11), LP infant samples NKG2A (N = 9), KIR (N = 10), EP adult samples NKG2A (N = 9), KIR (N = 8), LP adult samples NKG2A (N = 9), KIR (N = 8)). c Histogram overlay of flow cytometric data showing NKG2A and KIR expression by CD103+ (gray), CD49a+ (dark gray), and CD69+ (black) NK cells from infant and adult intestines. d Frequencies of infant (white circles) and adult (dark circles) intestinal NKG2A+ NK cells and KIR+ NK cells within CD103+, CD49a+, or CD69+ populations. NKG2A expression by infant EP CD103+ (N = 10), CD69+ (N = 10), and CD49a+ (N = 9) NK cells, NKG2A expression by infant LP-derived CD103+ (N = 9), CD69+ (N = 9), and CD49a+ (N = 8) NK cells. NKG2A expression by adult EP and LP-derived NK cells (N = 9). KIR expression by infant EP CD103+ (N = 11), CD69+ (N = 11), and CD49a+ (N = 9) NK cells. KIR expression by infant LP-derived CD103+ (N = 10), CD69+ (N = 10), and CD49a+ (N = 8) NK cells. KIR expression by adult EP (N = 9) and LP-derived (N = 8) NK cells. Median frequencies indicated by red lines. Error bars define interquartile ranges between 75th and 25th percentiles. Statistical comparisons are Mann-Whitney U comparisons (b) and Wilcoxon matched-pairs signed rank tests (d). Asterisks represent the following p-values: *p < 0.05 and **p < 0.01

