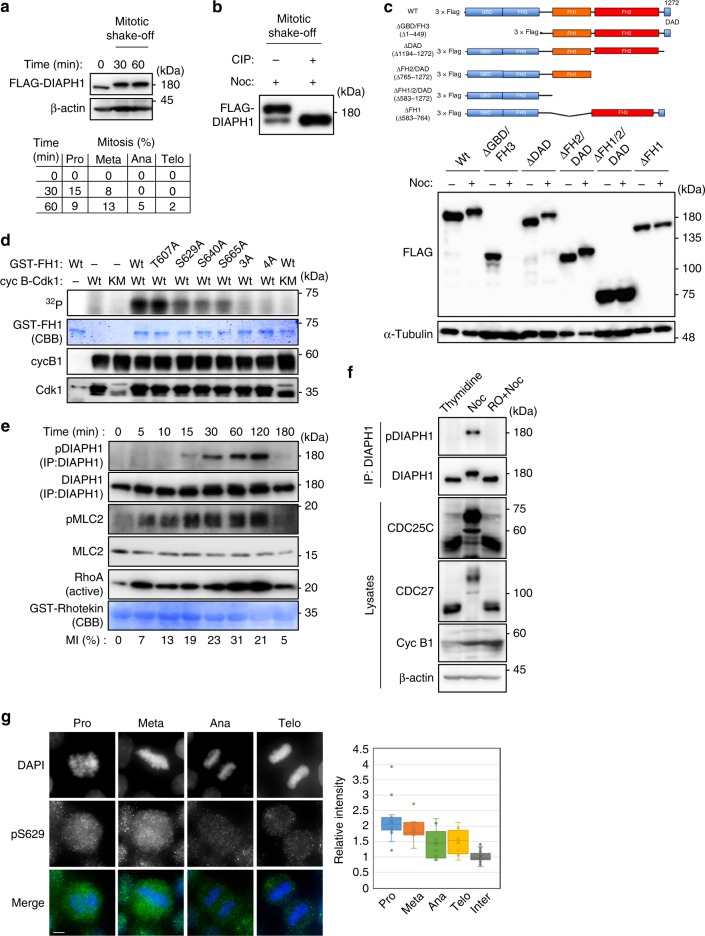
Fig. 1.
Cyclin B1-Cdk1 phosphorylates the FH1 domain of DIAPH1. a Upper panels: HeLa cells expressing 3×FLAG-DIAPH1 were synchronized at G2 by RO-3306 and then released into fresh medium. Samples were collected by mitotic shake-off at the indicated times. Samples were subjected to SDS–PAGE and immunoblotting with the indicated antibodies. Lower panel: mitotic progression was monitored by DAPI staining and the mitotic cells (%) was determined as the percentages of the total cell number (n = 100). b 3×FLAG-DIAPH1 was immunoprecipitated from nocodazole-treated HeLa cells collected by mitotic shake-off, treated with CIP, and subjected to immunoblotting using anti-FLAG antibodies. c Upper panels: schema of DIAPH1 domain deletion mutants. Lower panels: HeLa cells expressing 3×FLAG-DIAPH1-Wt or its deletion mutants were treated with or without nocodazole. Cell lysates were subjected to immunoblotting using the indicated antibodies. d In vitro kinase assay (32P) using purified Cyclin B1-Cdk1 Wt and its catalytically inactive KM mutant. GST-DIAPH1-FH1 (CBB), cyclin B1, and Cdk1 were immunoblotted using the indicated antibodies. e HeLa cells were treated as in a. Samples were collected at the indicated times and subjected to immunoprecipitation with anti-DIAPH1 antibodies or to pull-down experiments with purified GST-Rhotekin. The resultant precipitates were then subjected to immunoblotting with the indicated antibodies or to CBB staining. Mitotic cells were monitored by DAPI staining and the mitotic index (MI%) was determined as a percentage of the total cell number (n = 100). f Lysates from HeLa cells treated with a double-thymidine block, nocodazole shake-off (Noc), and RO-3306 treatment (10 min) plus nocodazole shake-off (RO + Noc) were subjected to immunoprecipitation with anti-DIAPH1 antibodies. The resultant precipitates (IP) and lysates were immunoblotted with the indicated antibodies. g Left: Asynchronous Hela cells were fixed with formaldehyde, and then subjected to immunostaining using anti-pS629 antibodies. Chromosomes were visualized by DAPI staining. Scale bar, 10 μm. Right: Relative signal intensities of cells in prophase, metaphase, anaphase, and telophase are shown. The background signal was subtracted in each field and the signal was then normalized using the average signal of three interphase cells. Whiskers are highest and lowest values excluding outliers. n = 112

