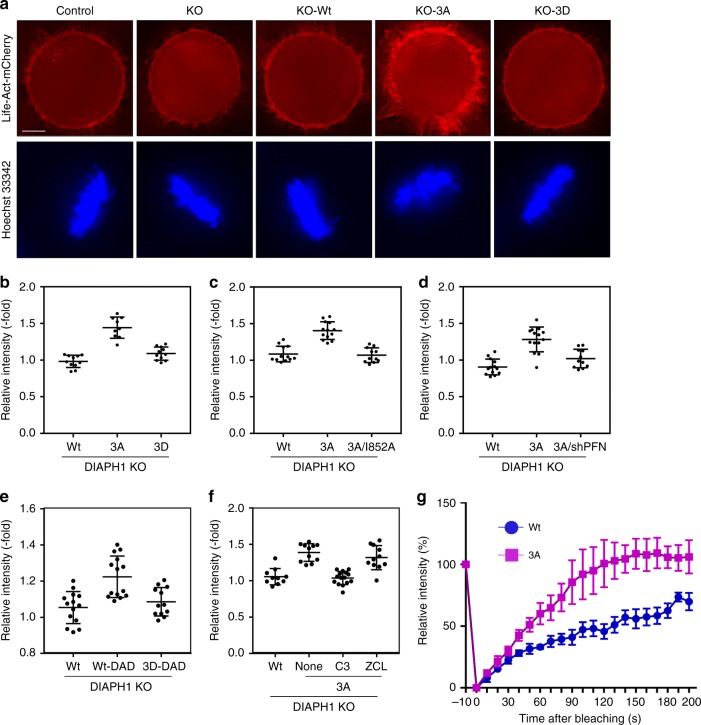
Fig. 3.
Expression of DIAPH1-3A accumulates F-actin on the cellular cortex. a Actin filaments are enriched on the cellular cortex of LifeAct-mCherry-KO-3A cells. Control or LifeAct-mCherry-KO-Wt, −3A, or −3D cells were stained with Hoechst 33342 for 10 min to monitor mitotic progression. Representative images shown are equally processed with BZ-II analysis software. Scar bar: 10 μm. b Cells as in a were imaged by microscopy without fixation. Relative signal intensities of mCherry at the cell cortex, cytoplasm, and background (the region without cells) were quantified using Image J software, the background was subtracted from each value, and their ratio (cortex,cytoplasm) was calculated. Wt: n = 11, 3A: n = 9, 3D: n = 11. Bars indicate means ± SD. c LifeAct-mCherry-KO-Wt, −3A, or −3A/I852A expressing-cells were analyzed as in a. Relative signal intensities of mCherry were quantified as in b. (Wt: n = 12, 3A: n = 13, 3A/I852A: n = 11). d LifeAct-mCherry-KO-Wt cells expressing tet-on shControl, or LifeAct-mCherry-KO-3A expressing tet-on shControl or tet-on shPFN1 in the presence of 1 μg/ml doxycycline were analyzed as in a. Relative signal intensities of mCherry were quantified in b. Wt: n = 13, 3A: n = 14, 3A-shPFN1: n = 11. e LifeAct-mCherry-KO-Wt, -Wt/DAD, or −3D/DAD cells were analyzed as in a. Relative signal intensities of mCherry were quantified in b. Wt: n = 14, Wt-DAD: n = 14, 3D-DAD: n = 12. f LifeAct-mCherry-KO-Wt or −3A cells were treated with or without 2 μg/ml C3 transferase or 50 μM ZCL278 for 30 min and were analyzed as in a. Relative signal intensities of mCherry were quantified in b. Wt: n = 10, 3A-none: n = 11, 3A-C3: n = 15, 3A-ZCL: n-11). g DIAPH1-KD-Wt or −3A cells were treated with SiR-Actin in order to visualize F-actin. Hoechst 33342 was added to the medium before the imaging. A circular area 0.1 μm in diameter at the actin cortex of a metaphase cell was bleached with the 633 nm laser (See Supplementary Figure 5). The relative signal intensity at the bleached region was quantified by Image J software. Bars indicate means ± SD. The signal intensities after bleaching were comparable to the cytosolic signal. Wt: n = 6, 3A: n = 7

