Fig. 5.
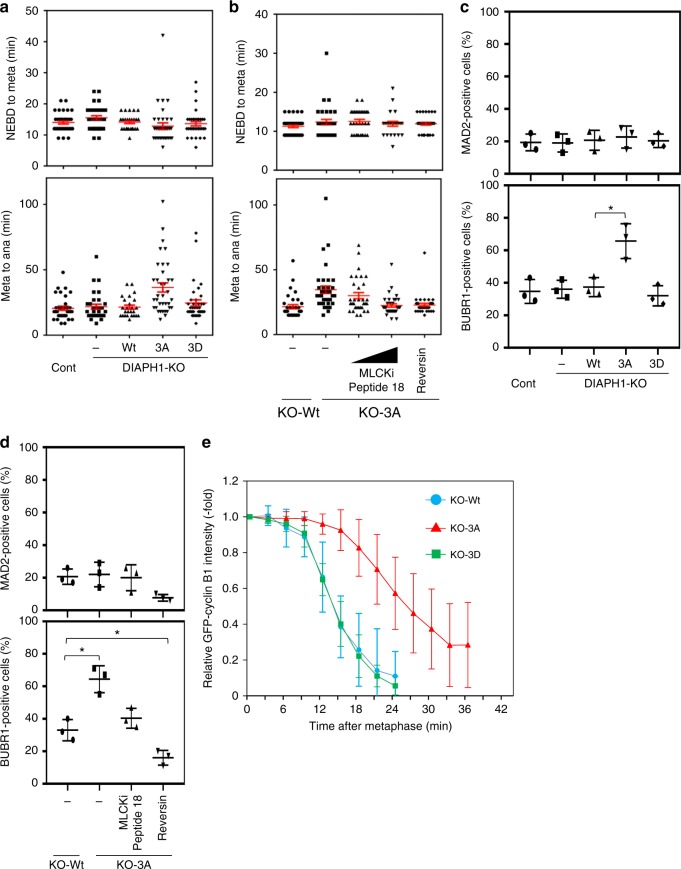
Proper anaphase onset requires DIAPH1 phosphorylation through inactivation of SAC. a Control (Cont) or H2B-mCherry-KO-Wt, −3A, or −3D cells were imaged by time-lapse microscopy every 3 min. The time interval between NEBD and metaphase or metaphase and anaphase was determined. Cont: n = 33, DIAPH1-KO: n = 30, KO-Wt: n = 24, KO-3A: n = 34, KO-3D: n = 34. Red bars indicate means ± SE. b H2B-mCherry-KO-Wt or −3A cells were treated with or without MLCK inhibitor peptide 18 (2 or 5 μM) or reversine (500 nM) for 30 min, and then imaged by time-lapse microscopy every 3 min. Wt: n = 33, 3A: n = 35 (2 μM MLCK inhibitor peptide 18) and n = 30 (5 μM MLCK inhibitor peptide 18), n = 25 (500 nM reversine). Durations were determined as in a and red bars indicate means ± SE. c Control (Cont) or KO-Wt, −3A, or −3D cells were stained with anti-MAD2 or anti-BUBR1 together with CREST antibodies. The number of metaphase cells showing co-localization of MAD2 or BUBR1 with CREST was counted (each n = 200). The results were obtained from three independent experiments. Bars indicate means ± SD. Statistical significance was determined by Student’s t-test. *p < 0.05. d KO-Wt or −3A cells were treated with or without MLCK inhibitor peptide 18 (5 μM) or reversine (500 nM) for 30 min, and analyzed as in a (each n = 200). The results were obtained from three independent experiments and analyzed as in c. *p < 0.05. e GFP-cyclin B-KO-Wt, −3A, or −3D cells were analyzed by time-lapse microscopy every 3 min. Fluorescence intensities of cyclin B1-EGFP were measured during metaphase progression (each n = 15), and the mean ± SD was plotted for each time point. Levels of fluorescence were normalized to the fluorescent values obtained at the metaphase alignment

