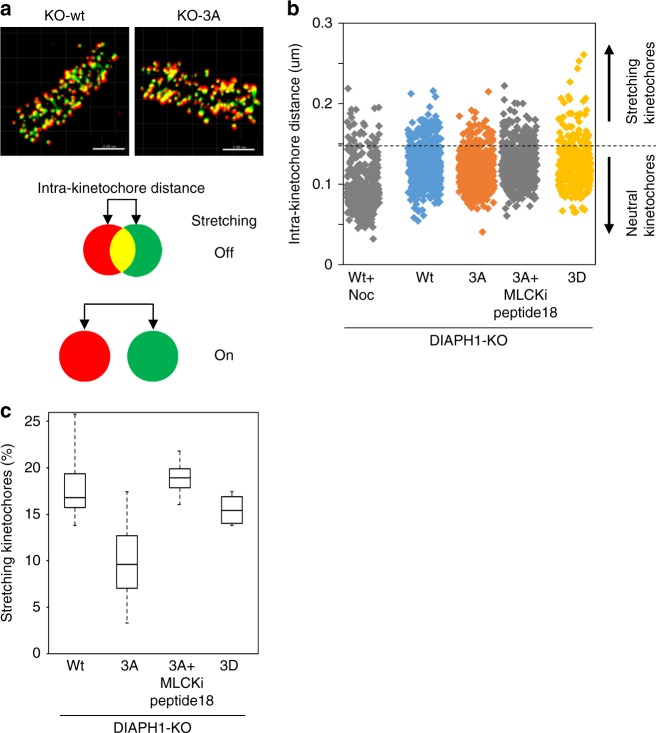
Fig. 6.
Impaired kinetochore stretching in KO-3A cells. a Cells were stained for Hec1 (red, outer kinetochore marker) and CREST (green, inner kinetochore marker), and metaphase cells were analyzed. Projections of three-dimensional images are shown. Bar: 2 μm. The intra-kinetochore distance is defined as the distance between the centroid of red and green signals, and kinetochores with a distance above the threshold (see below) were referred to as stretched kinetochores. b The intra-kinetochore distances of nocodazole (160 ng/ml (531.6 nM))-treated Wt HeLa cells (Wt + Noc., n = 233 kinetochores from 5 cells), and KO-Wt, −3A, −3A + MLCKi peptide 18 (5 μM) were plotted for 50 min, and KO-3D metaphase cells (n = 318, 339, and 462 kinetochores from 4, 4, and 5 cells, respectively) were plotted as well. We determined the 95% confidence interval from the Wt + Noc experiment to be 0.156 μm, which was set as the threshold for stretching (dotted line, Uchida et al.33). c The rate of stretched kinetochores is shown in b. Box plots indicate median, interquartile values and range

