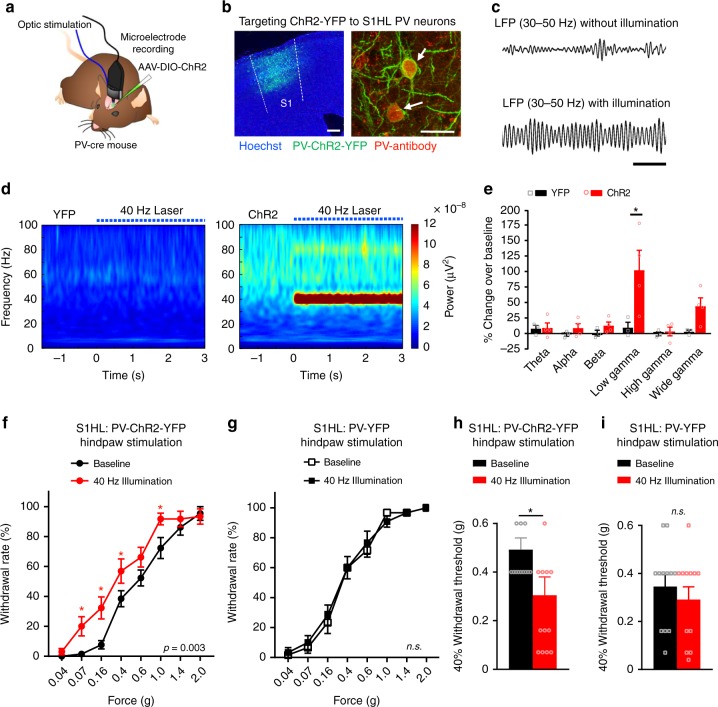
Fig. 4.
Enhancement of gamma-band oscillation power in the S1 cortex induces nociceptive hypersensitivity in mice. a Scheme of the experimental procedure. b Left: Expression of cre-dependent ChR2-EYFP in the S1HL of a PV-cre mouse (PV-ChR2-YFP). Scale bar represents 250 µm. Right: Co-labeling of cells stained with an anti-PV antibody and expressing ChR2-YFP in the S1HL. Scale bar represents 25 µm. c LFP bandpass filtered between 30 Hz and 50 Hz of a PV-ChR2-YFP mouse with and without 40 Hz laser illumination (472 nm; 10 trials). Scale bar represents 200 ms. d Time-frequency power representations during a 3 s illumination period with 40 Hz laser pulses (indicated by dotted blue line) of PV-ChR2-YFP mice (right) or control mice expressing YFP alone in PV neurons (left). Spectrograms represent grand means (n = 3 mice per group and 20 trials each). e Mean power changes (represented as % ERP over the 3 s 40 Hz illumination period normalized to a 1 s baseline period before illumination) in the theta (4–8 Hz), alpha (8–12 Hz), beta (15–29 Hz), low gamma (30–60 Hz), high gamma (60–100 Hz), and gamma (30–100 Hz) frequency bands in PV-YFP versus PV-ChR2-YFP animals (n = 3 in each group). f, g Paw withdrawal frequencies to graded von Frey stimulation of the hindpaw at baseline and during 40 Hz illumination in the contralateral S1HL of f PV-ChR2-YFP mice (n = 13; p = 0.003) and g PV-YFP control mice (n = 12; p = 0.69). h, i The 40% mechanical thresholds (from f and g) are shown at baseline and during 40 Hz illumination in h PV-ChR2-YFP mice (n = 13; p = 0.02) and i PV-YFP mice (n = 12; p = 0.42). *p < 0.05, two-way repeated measurements ANOVA with Bonferroni multiple comparisons (e, f, g) and Student’s paired t-test (h, i). p-values in f and g indicate significance of the effects of 40 Hz illumination treatment over the entire stimulus–response curve; n.s., not significant. Data are represented as mean ± S.E.M.

