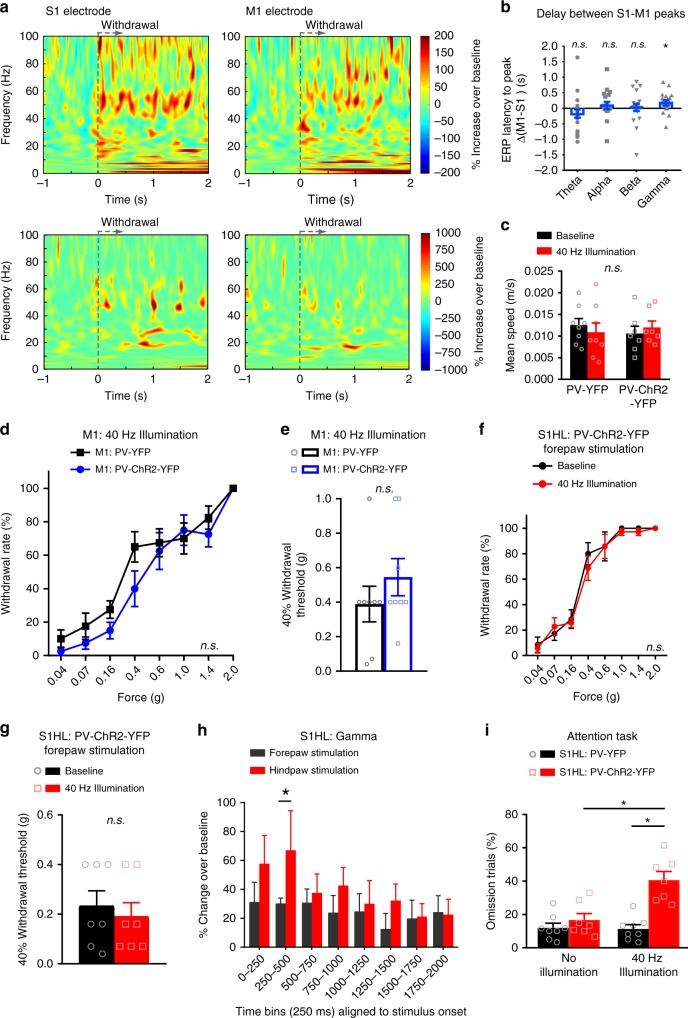
Fig. 6.
Enhanced gamma activity evoked by noxious stimulation is not related to motor activity. a Averaged (top row, n = 4 mice) and single trial examples (bottom row) of time-frequency representation of spectral modulation recorded simultaneously in S1HL (left) and M1 (right) of a paw withdrawal trial in response to 2 g von Frey stimulation. Power is coded as % ERP representing the deviation from the mean over a 1000 ms baseline period. b Comparison of difference in the peak time of stimulation-evoked ERP across frequency bands between M1 and S1 electrodes in individual trials (n = 20 withdrawal trials from four mice). c Mean running speed (analyzed over 20 min) of PV-YFP (n = 8) and PV-ChR2-YFP (n = 7) mice at baseline or S1HL 40 Hz illumination (p > 0.05, two-way ANOVA). d Paw withdrawal frequencies to hindpaw mechanical stimulation during 40 Hz illumination of the contralateral motor cortex (M1) in mice expressing either YFP or ChR2-YFP in M1 (n = 8/group; p = 0.30) and e the corresponding 40% mechanical thresholds (p = 0.31). f Withdrawal frequencies to forepaw von Frey stimulation at baseline and 40 Hz illumination of the S1HL cortex of mice expressing PV-ChR2-YFP in the S1HL (n = 7; p = 0.94) and g the corresponding 40% mechanical thresholds (n = 7; p = 0.69). h Comparison of change in mean event-related perturbation in S1HL power over a 1000 ms baseline in the high gamma frequency band evoked by stimulating either the contralateral forepaw or hindpaw with a 2 g von Frey filament (5–7 applications per paw) (n = 7; *p < 0.05). i The percentage of omission of attention trials in the 5-choice serial reaction task in the absence and presence of 40 Hz illumination of mice expressing PV-YFP (n = 8) or PV-ChR2-YFP (n = 7) in the S1HL (p < 0.0001). *p < 0.05, one-sample t-test for deviation from zero (b), two-way repeated measures ANOVA with Bonferroni multiple comparisons (d, f, h, i), unpaired t-test (e), Student’s paired t-test (g). n.s., not significant. Data are represented as mean ± S.E.M.

