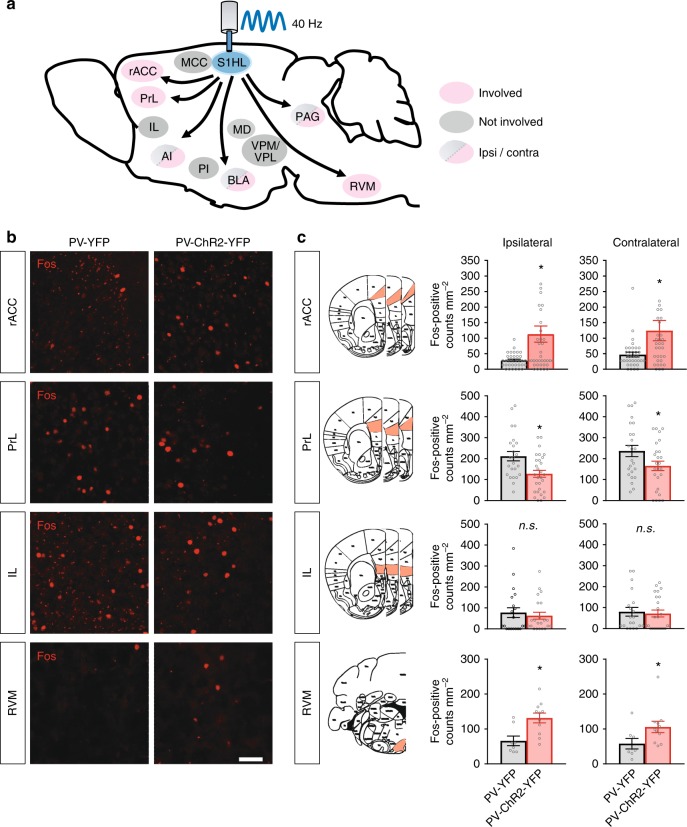
Fig. 8.
Functional c-Fos mapping (for neuronal activation) of brain regions altered in activity following optogenetically induced gamma activity in the S1HL cortex in PV-ChR2-YFP mice. a Schematic representation of pain-related brain areas that were analyzed in the experiment. Red shading: regions altered in activity; gray shading: regions not altered. Arrows do not necessarily indicate direct afferent connections. Regions showing differences in Fos expression between the ipsi- versus contralateral areas are additionally indicated with the corresponding color codes in the scheme. b Typical example of changes in Fos expression in the rACC, the RVM, PrL, and IL. c Quantitative summary of changes in c-Fos expression in diverse brain regions following entrainment of gamma rhythm in the S1HL in the PV-ChR2-YFP mice (n = 7–9 mice per brain region analyzed) or blue photo-illumination of the S1HL in control PV-YFP mice (n = 6–8 mice per brain region analyzed). Differences in Fos-positive counts between YFP and ChR2-YFP mice following 40 Hz illumination were analyzed in the ipsilateral and contralateral rostral anterior cingulate cortex (rACC; p = 0.003 and 0.07, respectively), prelimbic cortex (PrL; p = 0.003 and 0.047, respectively), infralimbic cortex (IL; p = 0.60 and 0.75, respectively) and the rostroventral medulla (RVM; p = 0.005 and 0.049, respectively). The RVM analyzed included the raphe magnus nucleus and gigantocellular reticular nucleus, alpha region. *p < 0.05, unpaired t-test; n.s., not significant. Scale bars represent 50 µm in b. Data are represented as mean ± S.E.M.

