Figure 1.
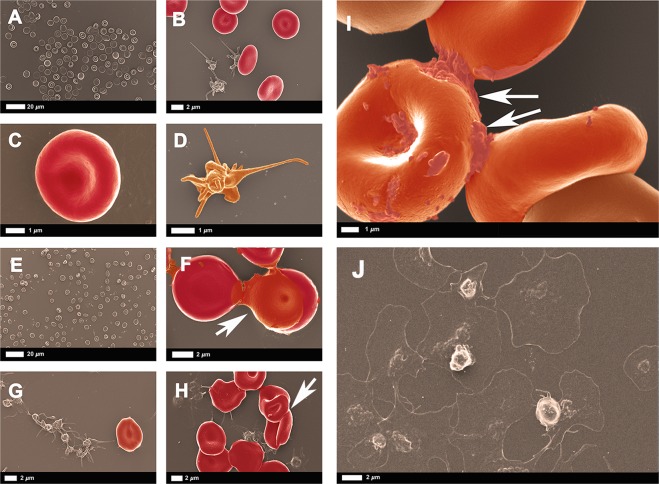
(A–D) WB smear prepared from healthy citrated blood. (A,C) Biconcave RBCs at different magnifications. (B) Platelets with slight pseudopodia formation. (D) Higher magnification of a representative healthy platelet with slight pseudopodia formation due to contact activation. (E–I) WB smear prepared from healthy citrated blood after exposure to SAA. WB incubated with 30 μg.mL−1 SAA show RBC agglutination (E,F) and activated and aggregated platelets (G,H). (I) WB incubated with 100 μg.mL−1 SAA reveals, at higher magnification, agglutinated RBCs with activated platelets; arrows indicate agglutination. (J) Example of platelet (hyperactivation) seen in type 2 diabetes (from raw data27). See scale bar below each micrograph.

