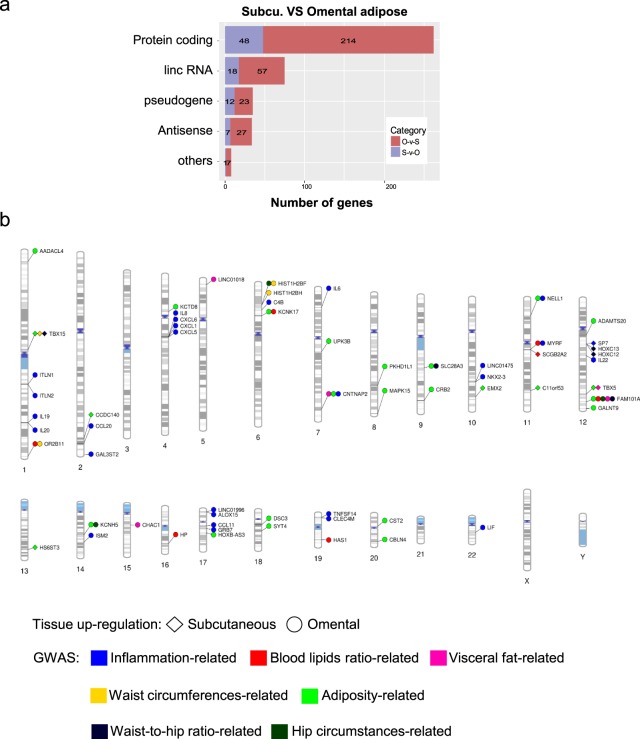
Figure 4.
Classification and whole genome visualization of differentially expressed genes between two different adipose depots. (a) Classification of DEGs between subcutaneous and omental adipose tissues. DEGs in the two adipose depots were categorized into five groups including protein-coding, lincRNA, pseudogene, antisense RNA, and others. (b) Plotting DEGs between two different adipose tissues. The graphics illustrate association between DEGs in two different adipose depots and previously reported genes from GWAS studies plotted on ideograms of all chromosomes. Lines are plotted on chromosomal regions corresponding to the matched locations between DEGs and GWAS loci and then connected to different shapes representing different tissue abundancy: diamond, highly expressed genes in subcutaneous adipose tissue; circle, highly expressed genes in omental adipose tissue. GWAS phenotypes are color-coded to represent different categories. A detailed list of phenotypes and associations is presented in Supplementary Table 4.

