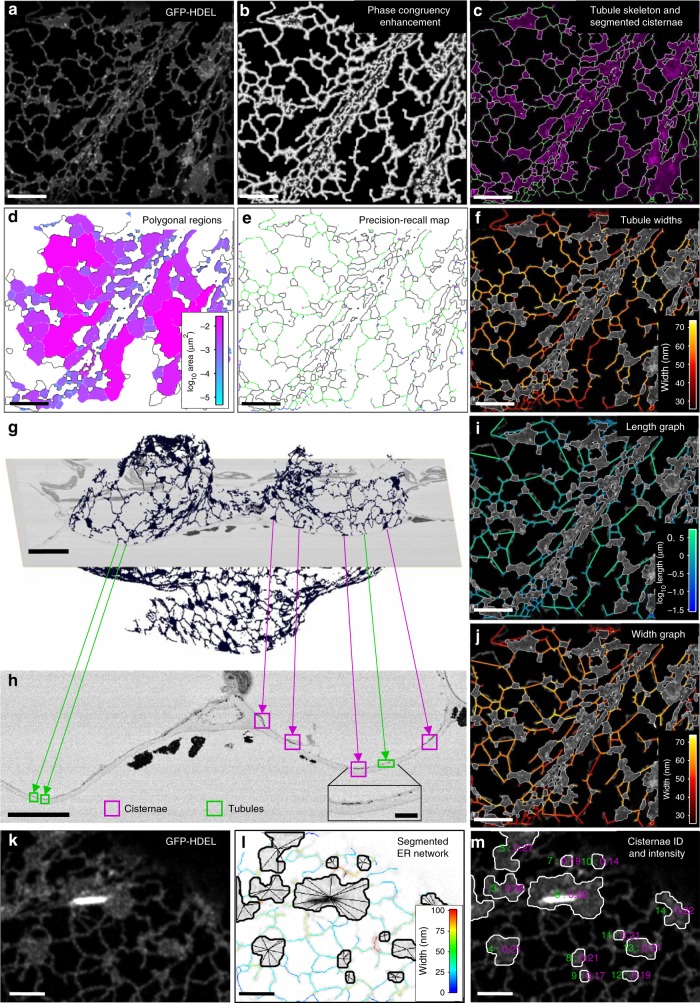
Fig. 1.
Automated ER network analysis. a Analysis of a single tobacco leaf epidermal cell expressing the ER lumenal marker GFP-HDEL from a single paradermal optical section; b phase congruency enhancement of tubular elements using the local weighted mean phase angle; c hysteresis thresholding and thinning to produce a single pixel skeleton (green), and segmented cisternal structures (magenta with white boundary) following opening and active contour refinement; d polygonal regions pseudo-colour coded by log10 area; e comparison of the skeleton with a manually digitised ground truth (cisternae, black; true positives, green; false positives, blue; false negatives, magenta); f tubule width estimation using integrated granulometry; g A 3D reconstruction of the ER from an Arabidopsis leaf epidermal cell captured by SBF-SEM after zinc-iodine-osmium (ZIO) staining; h Enlargement of an SBF-SEM cross-section highlighting elements of tubular ER in green and cisternae in magenta, with a zoomed inset image (scale bar = 1 µm); i, j Graph representation of the ER network, with nodes at junctions linked by edges with a vector of properties including tubule length (i) and average width, excluding junctions (j). All scale bars = 5 µm, unless stated otherwise. k Arabidopsis plants stably expressing GFP-HDEL show high-intensity fluorescence concentrated in a single fusiform body within the ER; l segmentation of the cisterna containing the fusiform body using the lowest of multiple partitions of the image intensity histogram, with superimposed pixel skeleton colour-coded by width; m the maximum intensity value (magenta) is associated with a unique cisternal ID (green) which can be used to identify cisternae associated with fusiform bodies enabling separate quantification of their properties and behaviour. Scale bars = 2 µm

