Fig. 2.
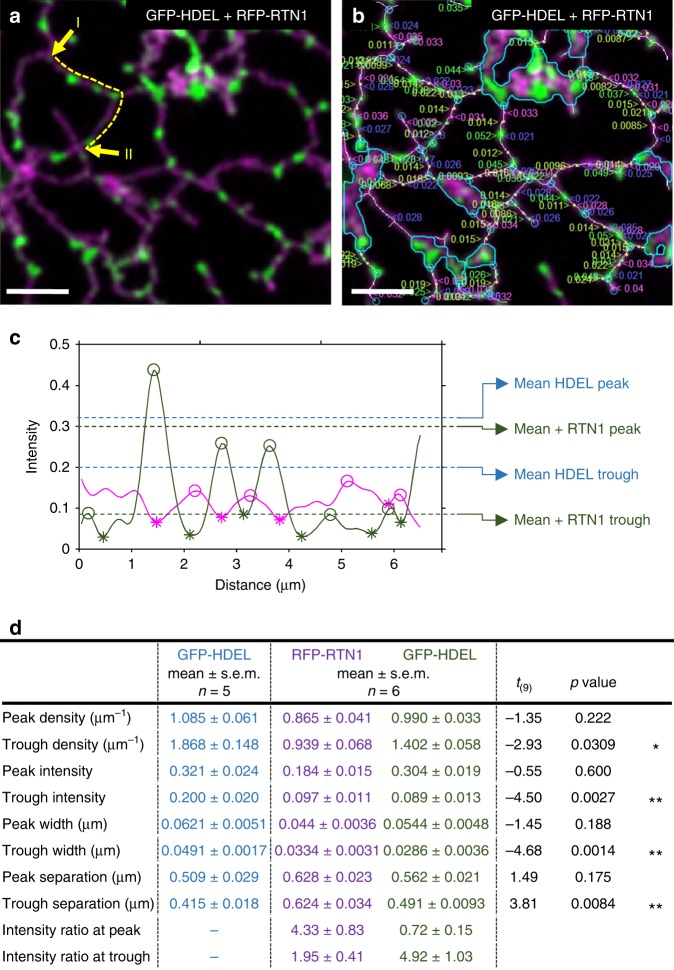
ER tubule morphology analysis. a A merged two-channel confocal optical section following transient over-expression of RFP-RTN1 (magenta) and GFP-HDEL (green) in tobacco leaf epidermal cells. b Automatic measurement of peaks and troughs for both RFP-RTN1 (left justified labels, peaks in magenta, troughs in blue) and GFP-HDEL (right justified labels, peaks in green, troughs in yellow). The underlying pixel skeleton is superimposed in white and the position of nodes indicated in cyan. Cisternae are also outlined in cyan. c Selected trace analysis between the yellow arrows in (a) showing the relative intensity for RFP-RTN1 (magenta) and GFP-HDEL (green), with the position of the peaks (open circles) and troughs (asterisks) indicated. The average values for peaks and troughs for the HDEL signal across all experiments are indicated in the presence and absence of RFP-RTN1. d Summary of tubule morphology metrics (mean ± s.e.m.) for GFP-HDEL alone (n = 5) and co-expressed with RFP-RTN1 (n = 6), with T-test statistic, associated p-value and significance, where *p < 0.05 and **p < 0.01. All scale bars = 5 µm. Source data are provided as a Source Data file

