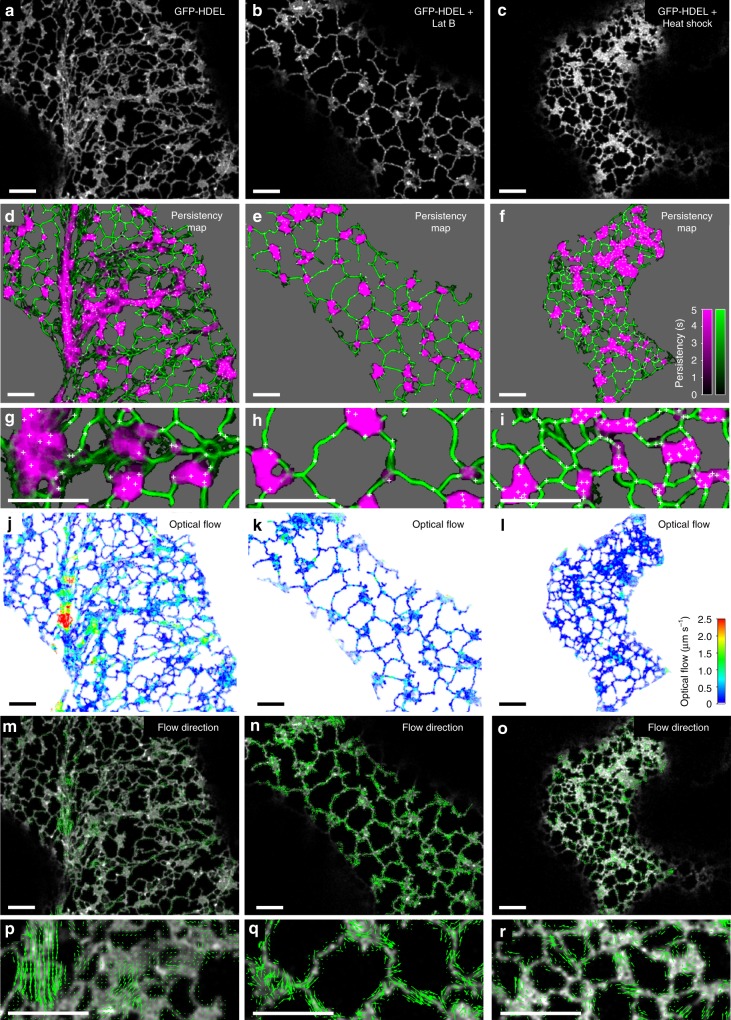
Fig. 4.
Mapping ER persistency and movement over time. The middle frame from a 50-frame time-series image taken at 0.41 s intervals of GFP-HDEL transiently expressed in tobacco leaf epidermal cells (a); after treatment with Lat B (b); or heat shock (42 °C, 20 min) (c). d–f persistency maps calculated using a 12 frame lag period (~5 s) for cisternae (magenta), tubules (green) and nodes (white crosses), with the background set to grey. The intensity corresponds to the length of time each pixel is occupied in the time series according to the inset scales; g–i Enlarged (3×) regions from the approximate centre of each image. j–l Optical flow analysis between the middle two frames of the same time series images for comparison. Images are pseudo-colour coded on the inset scale between zero (blue) and 2.5 µm s−1 (red). m–o Predicted direction of ER network movement with arrows scaled to a maximum value of 2.5 µm s−1. p–r Enlarged (3×) regions from the approximate centre of each image. All scale bars = 5 µm

