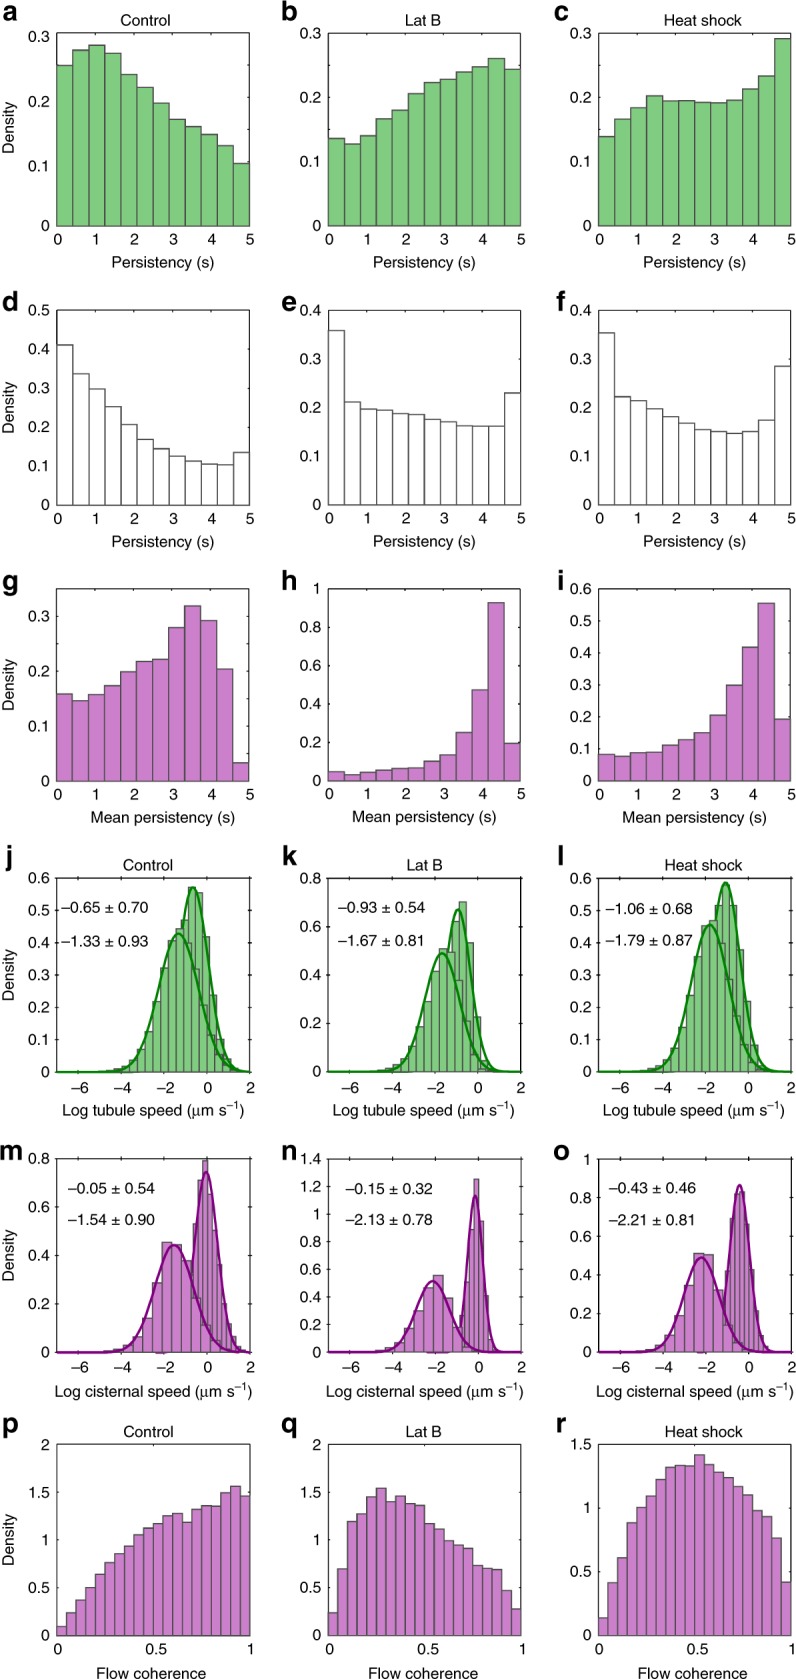
Fig. 5.

Distributions of persistency and optical flow analysis of ER dynamics. Probability density distributions of the mean persistency for tubules (a–c, green), nodes (d–f, white), and cisternae (g–i, magenta) for GFP-HDEL (a, d, g), and following treatment with Lat B (b, e, h) or heat shock (c, f, i). Probability density distributions of the log mean vector magnitude and log maximum speed of tubules (j–l, green) and cisternae (m–o, magenta), for the different treatments. Numerical values for the mean ± SD for the Gaussian fits to the mean (lower text) and max (upper text) distributions are inset. p–r Flow coherence for cisternae for the different treatments. (GFP-HDEL, n = 6, Lat B, n = 8, Heat shock, n = 8, where n is the number independent 50-frame time-series images). Source data are provided as a Source Data file
