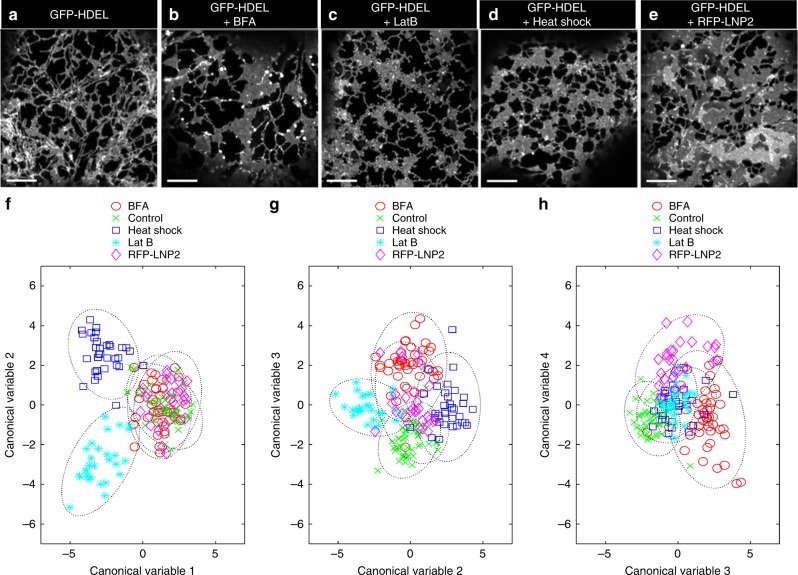
Fig. 6.
Multivariate analysis of ER morphology and dynamics. Representative single optical sections of tobacco leaf epidermal cells transiently expressing GFP-HDEL (a, n = 46); after treatment with BFA (b, n = 46); Lat B (c, n = 28); heat shock (d, n = 33); or over-expression of RFP-LNP2 (e, n = 29), where n is the number of independent 5-frame time-series images. All scale bars = 5 µm. Pairwise scatter plots of the first 4 significant canonical variables from the MANOVA analysis grouped by treatment (f–h). The dotted line around each group represents the 95% confidence limit

