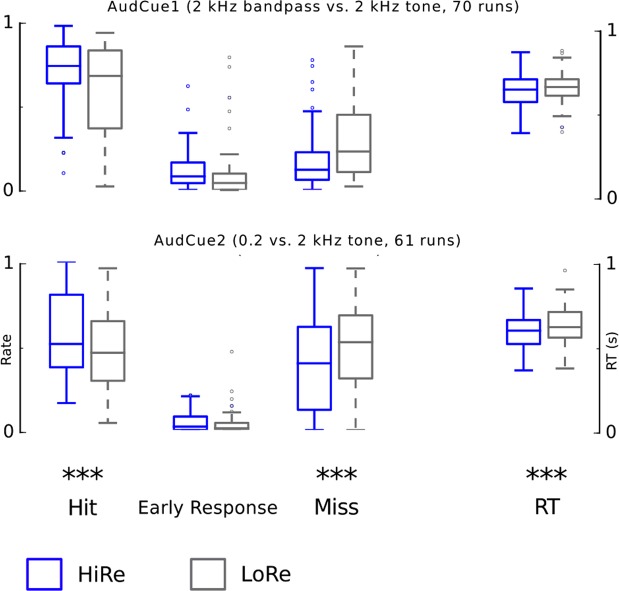
Figure 2.
Performance in the AudCue behavioral experiments. Performance in AudCue1(top) and AudCue2 (bottom). The two leftmost box plots show mean hit rate across each run in the three monkeys for HiRe (blue) and LoRe (gray) trials. The other box plots show the early response rate, miss rate and reaction times (RT) correspondingly. The scale for RT is on the right side. Note that responses were classified as hit, early response or miss (i.e. in each run, HR + ER + MR = 1). Asterisks indicate significant differences between HiRe and LoRe trials [i.e. main effect of reward, *P < 0.05, **P < 0.01 and ***P < 0.001; AudCue: linear mixed model with factors reward (HiRe, LoRe), monkey (M1, M2, M3) and experiment (Audcue1, Audcue2)]. See results and Table 2 for details. The whiskers indicate 1.5 times the interquartile range (IQR) from the first and third quartile. The horizontal line inside the box indicates the sample median. Note that the significance values are for the repeated measures factor (reward cue), thus, for example, the variation in the difference score between HiRe and LoRe RT’s is smaller than one would expect from the box blots.

