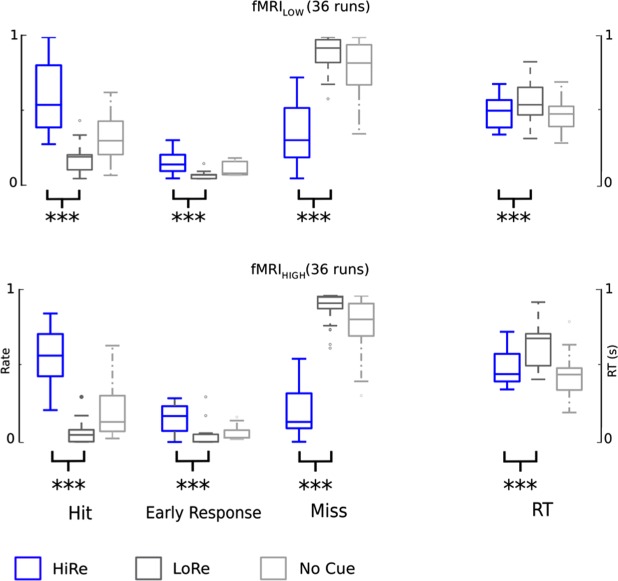
Figure 5.
Performance during fMRI. Results are illustrated for fMRIHIGH (Top) and in fMRILow (bottom). HiRe trials are depicted in blue, LoRe in gray and NoCue in light gray. Asterisks indicate significant differences between HiRe and LoRe trials (main effect of reward, *P < 0.05, **P < 0.01 and ***P < 0.001; linear mixed model with factors reward (HiRe, LoRe), monkey (M1, M2), and auditory wait signal (fMRIHIGH, fMRILOW)]. For details see text and Table 3.

