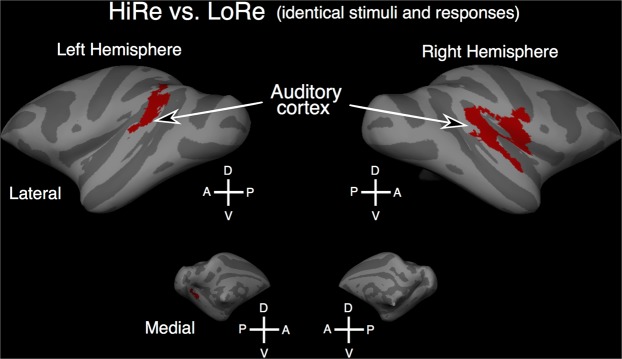
Figure 6.
Brain areas showing stronger activation during HiRe than LoRe trials. Results are shown on inflated cortical surfaces (gyri: light gray; sulci: dark gray). The comparisons (Welch’s v test) were performed in surface space across 1st level contrast parameter estimates and permutation inference was used to assess statistical significance (red clusters; HiRe vs. baseline and LoRe vs. baseline contrast parameter estimates, the runs of each monkey were treated as a permutation and variance group to accommodate heteroscedasticity, initial cluster-forming Z threshold 2.6, cluster-corrected P < 0.05). Note that the same P-value is attributed to the whole cluster in the PALM analysis, so differential P-value responses mapped to the brain should not be expected. Abbreviations: D dorsal, V ventral, A anterior, P posterior.

