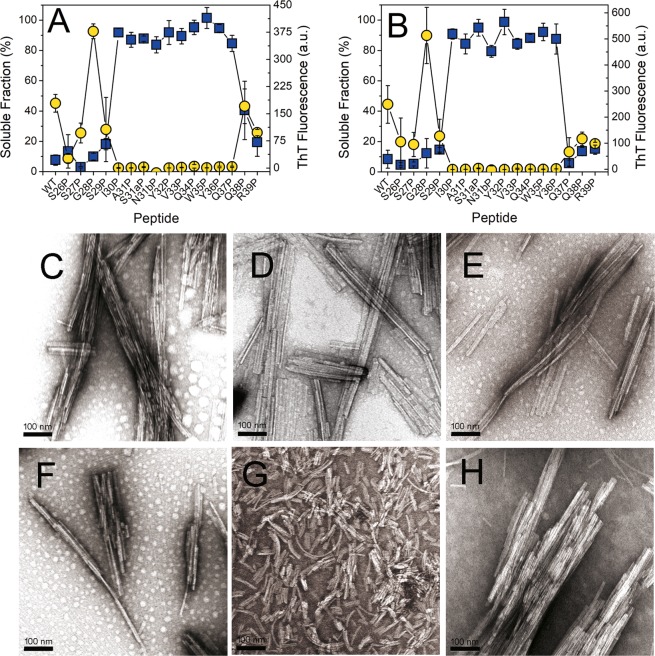
Figure 9.
Fibrillogenesis of the single mutants of the highly fibrillogenic peptide Ser26-Arg39 to proline (Scanning proline mutagenesis analysis). Panels (A,B) show the mean value plus the standard deviation of soluble fraction (blue squares) and ThT fluorescence (yellow circles) calculated from triplicates samples after (A) 16 hours and (B) 40 hours of incubation. Transmission electron micrographs of the aggregates formed by the point mutant peptides (C) Ser26Pro, (D) Ser27Pro, (E) Gly28Pro, (F) Ser29Pro, (G) Gln38Pro and (H) Arg39Pro. The scale bars represent 100 nm. The images were obtained with a HITACHI-7100 transmission electron microscope.

