Figure 1.
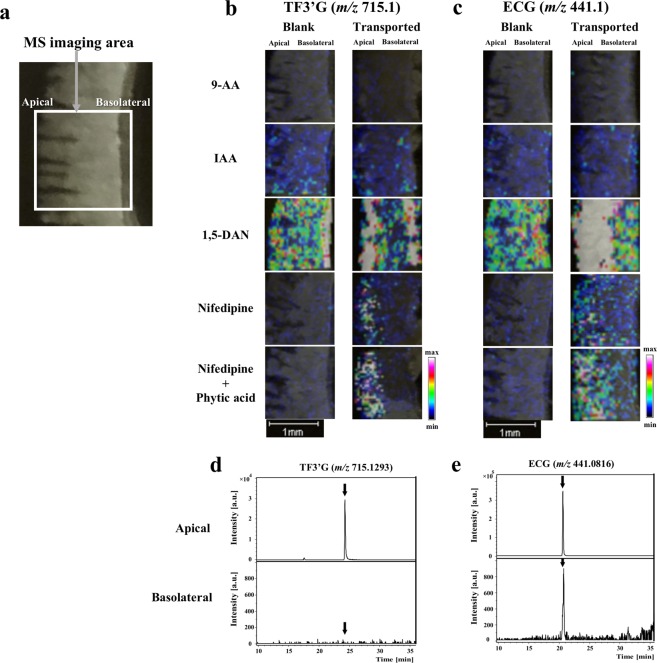
MALDI-MSI-based detection of TF3′G and ECG in the SD rat jejunum membranes. Representative optical image of the rat jejunum membrane (a), distribution of TF3′G (b) and ECG (c) in the membranes and LC-TOF-MS chromatograms of TF3′G (d) and ECG (e) in the apical and basolateral solutions after 50 µM, 60-min transport experiments in the Ussing Chamber system. Matrix reagents, including 9-AA (10 mg/mL), IAA (20 mg/mL), 1,5-DAN (20 mg/mL), nifedipine (20 mg/mL), and nifedipine (20 mg/mL) containing 5 mM phytic acid in acetonitrile/water (3:1, v/v), were sprayed individually onto the sections mounted onto ITO glass slides. TF3′G (m/z 715.1) and ECG (m/z 441.1) were visualised via MALDI-MSI in the negative ion-linear mode at the spatial resolution of 50 µm. Intensity signals corresponding to TF3′G and ECG are shown as fixed pseudocolour scales. LC separations were performed on a Cosmosil 5C18-MS-II column (2.0 mm × 150 mm) and eluted for 30 min with 0% to 100% MeOH/FA (100/0.1, v/v). MS conditions are described in the Methods section.

