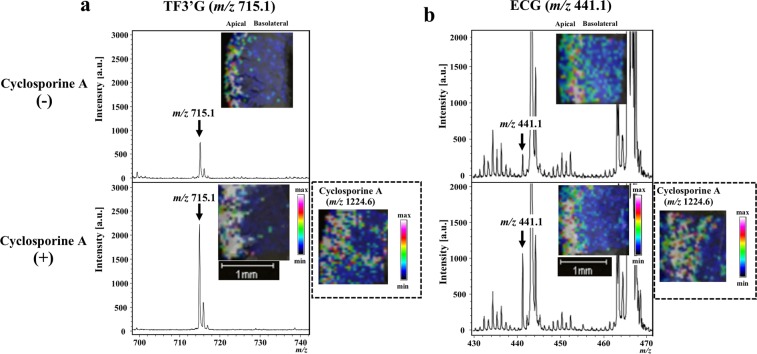
Figure 3.
MALDI-MSI visualisation of TF3′G and ECG in jejunum membranes subjected to 60-min transport experiments in the absence or presence of efflux transport inhibitor. Cyclosporine A (20 µM) was used as the efflux transport inhibitor. TF3′G (m/z 715.1) and ECG (m/z 441.1) were visualised via MALDI-MSI in the negative ion-linear mode at a spatial resolution of 50 µm using nifedipine/phytic acid as the matrix reagent. For visualisation of cyclosporine A (m/z 1224.6), DHB (acetonitrile/water, 3/1, v/v, 20 mg/mL) was used as the matrix reagent in the positive ion-linear mode. Intensity signals corresponding to TF3′G, ECG, and cyclosporine A are shown as fixed pseudocolour scales.

